Ceph使用---dashboard启用及Prometheus监控
一、Ceph dashboard介绍
Ceph dashboard 是通过一个 web 界面, 对已经运行的 ceph 集群进行状态查看及功能配置等功能, 早期 ceph 使用的是第三方的 dashboard 组件。
如:Calamari
Calamari 对外提供了十分漂亮的 Web 管理和监控界面, 以及一套改进的 REST API 接口(不同于 Ceph 自身的 REST API) , 在一定程度上简化了 Ceph 的管理。 最初 Calamari 是作为Inktank 公司的 Ceph 企业级商业产品来销售, 红帽 2015 年收购 Inktank 后为了更好地推动 Ceph 的发展, 对外宣布 Calamari 开源
https://github.com/ceph/calamari
优点:
- 管理功能好
- 界面友好
- 可以利用它来部署 Ceph 和监控 Ceph
缺点:
- 非官方
- 依赖 OpenStack 某些包
VSM
Virtual Storage Manager (VSM)是 Intel 公司研发并且开源的一款 Ceph 集群管理和监控软件, 简化了一些 Ceph 集群部署的一些步骤, 可以简单的通过 WEB 页面来操作。
https://github.com/intel/virtual-storage-manager
优点:
- 易部署
- 轻量级
- 灵活(可以自定义开发功能)
缺点:
- 监控选项少
- 缺乏 Ceph 管理功能
Inkscope
Inkscope 是一个 Ceph 的管理和监控系统, 依赖于 Ceph 提供的 API, 使用 MongoDB来存储实时的监控数据和历史信息。
https://github.com/inkscope/inkscope
优点:
- 易部署
- 轻量级
- 灵活(可以自定义开发功能)
缺点:
- 监控选项少
- 缺乏 Ceph 管理功能

Ceph-Dash
Ceph-Dash 是用 Python 开发的一个 Ceph 的监控面板, 用来监控 Ceph 的运行状态。同时提供 REST API 来访问状态数据。
http://cephdash.crapworks.de/
优点:
- 易部署
- 轻量级
- 灵活(可以自定义开发功能)
缺点:
- 功能相对简单
二、启用dashboard 插件
https://docs.ceph.com/en/mimic/mgr/
https://docs.ceph.com/en/latest/mgr/dashboard/
https://packages.debian.org/unstable/ceph-mgr-dashboard #15 版本有依赖需要单独解决Ceph mgr 是一个多插件(模块化)的组件, 其组件可以单独的启用或关闭。
以下为在ceph-deploy 服务器操作:
新版本需要安装 dashboard, 而且必须安装在 mgr 节点, 否则报错如下:
The following packages have unmet dependencies:
ceph-mgr-dashboard : Depends: ceph-mgr (= 15.2.13-1~bpo10+1) but it is not going to
be installed
E: Unable to correct problems, you have held broken packages.
在所有ceph-mgr节点安装ceph-dashboard插件
[root@ceph-mgr1 ~]# apt-cache madison ceph-mgr-dashboard
ceph-mgr-dashboard | 16.2.10-1focal | https://mirrors.tuna.tsinghua.edu.cn/ceph/debian-pacific focal/main amd64 Packages
ceph-mgr-dashboard | 15.2.16-0ubuntu0.20.04.1 | https://mirrors.tuna.tsinghua.edu.cn/ubuntu focal-updates/universe amd64 Packages
ceph-mgr-dashboard | 15.2.12-0ubuntu0.20.04.1 | https://mirrors.tuna.tsinghua.edu.cn/ubuntu focal-security/universe amd64 Packages
ceph-mgr-dashboard | 15.2.1-0ubuntu1 | https://mirrors.tuna.tsinghua.edu.cn/ubuntu focal/universe amd64 Packages
[root@ceph-mgr1 ~]# apt install ceph-mgr-dashboard
启用dashboard
cephadmin@ceph-deploy:~/ceph-cluster$ ceph mgr module -h #查看帮助
cephadmin@ceph-deploy:~/ceph-cluster$ ceph mgr module ls #16.2.10新版本模块太多,大概3200行左右
 View Code
cephadmin@ceph-deploy:~/ceph-cluster$ ceph mgr module enable dashboard
cephadmin@ceph-deploy:~/ceph-cluster$
Error ENOENT: all mgr daemons do not support module 'dashboard', pass --force to force enablement
解决方案:在所有mgr节点安装:ceph mgr module enable dashboard
注:模块启用后还不能直接访问, 需要配置关闭 SSL 或启用 SSL 及指定监听地址。
启用 dashboard 模块
Ceph dashboard 在 mgr 节点进行开启设置, 并且可以配置开启或者关闭 SSL, 如下:
cephadmin@ceph-deploy:~/ceph-cluster$ ceph config set mgr mgr/dashboard/ssl false #关闭SSL
cephadmin@ceph-deploy:~/ceph-cluster$
cephadmin@ceph-deploy:~/ceph-cluster$ ceph config set mgr mgr/dashboard/ceph-mgr1/server_addr 172.16.88.111 #指定dashboard监听地址
cephadmin@ceph-deploy:~/ceph-cluster$
cephadmin@ceph-deploy:~/ceph-cluster$ ceph config set mgr mgr/dashboard/ceph-mgr1/server_port 9009 #指定dashboard监听端口
cephadmin@ceph-deploy:~/ceph-cluster$
cephadmin@ceph-deploy:~/ceph-cluster$ ceph mgr services
{}
cephadmin@ceph-deploy:~/ceph-cluster$ ceph mgr services #查看ceph-mgr dashboard监听端口
{
    "dashboard": "http://172.16.88.111:9009/"
}
cephadmin@ceph-deploy:~/ceph-cluster$
cephadmin@ceph-deploy:~/ceph-cluster$ ceph -s  #检查ceph集群健康状态
  cluster:
    id:     8dc32c41-121c-49df-9554-dfb7deb8c975
    health: HEALTH_OK

  services:
    mon: 3 daemons, quorum ceph-mon1,ceph-mon2,ceph-mon3 (age 33h)
    mgr: ceph-mgr1(active, since 7m), standbys: ceph-mgr2
    mds: 2/2 daemons up, 2 standby
    osd: 9 osds: 9 up (since 33h), 9 in (since 7d)
    rgw: 2 daemons active (2 hosts, 1 zones)

  data:
    volumes: 1/1 healthy
    pools:   13 pools, 433 pgs
    objects: 843 objects, 1.8 GiB
    usage:   6.2 GiB used, 894 GiB / 900 GiB avail
    pgs:     433 active+clean

  io:
    client:   29 KiB/s rd, 0 B/s wr, 28 op/s rd, 19 op/s wr

cephadmin@ceph-deploy:~/ceph-cluster$
[root@ceph-mgr1 ~]# netstat -tnlp
Active Internet connections (only servers)
Proto Recv-Q Send-Q Local Address           Foreign Address         State       PID/Program name
tcp        0      0 172.16.88.111:6805      0.0.0.0:*               LISTEN      22005/ceph-mgr
tcp        0      0 127.0.0.53:53           0.0.0.0:*               LISTEN      666/systemd-resolve
tcp        0      0 0.0.0.0:22              0.0.0.0:*               LISTEN      1144/sshd: /usr/sbi
tcp        0      0 0.0.0.0:40825           0.0.0.0:*               LISTEN      790/rpc.statd
tcp        0      0 127.0.0.1:6010          0.0.0.0:*               LISTEN      21235/sshd: root@pt
tcp        0      0 127.0.0.1:6011          0.0.0.0:*               LISTEN      22259/sshd: root@pt
tcp        0      0 0.0.0.0:9443            0.0.0.0:*               LISTEN      7627/radosgw
tcp        0      0 0.0.0.0:9900            0.0.0.0:*               LISTEN      7627/radosgw
tcp        0      0 0.0.0.0:111             0.0.0.0:*               LISTEN      1/init
tcp        0      0 172.16.88.111:6800      0.0.0.0:*               LISTEN      7187/ceph-mds
tcp        0      0 172.16.88.111:9009      0.0.0.0:*               LISTEN      22005/ceph-mgr
tcp        0      0 172.16.88.111:6801      0.0.0.0:*               LISTEN      7187/ceph-mds
tcp        0      0 127.0.0.1:42225         0.0.0.0:*               LISTEN      777/containerd
tcp        0      0 172.16.88.111:6802      0.0.0.0:*               LISTEN      855/ceph-mds
tcp        0      0 172.16.88.111:6803      0.0.0.0:*               LISTEN      855/ceph-mds
tcp        0      0 172.16.88.111:6804      0.0.0.0:*               LISTEN      22005/ceph-mgr
tcp6       0      0 :::22                   :::*                    LISTEN      1144/sshd: /usr/sbi
tcp6       0      0 ::1:6010                :::*                    LISTEN      21235/sshd: root@pt
tcp6       0      0 ::1:6011                :::*                    LISTEN      22259/sshd: root@pt
tcp6       0      0 :::37979                :::*                    LISTEN      790/rpc.statd
tcp6       0      0 :::2049                 :::*                    LISTEN      887/ganesha.nfsd
tcp6       0      0 :::111                  :::*                    LISTEN      1/init
tcp6       0      0 :::8080                 :::*                    LISTEN      21994/ceph-mgr
[root@ceph-mgr1 ~]#
如果出现"Module 'dashboard' has failed: OSError("Port 8080 not free on '::'")"
cephadmin@ceph-deploy:~/ceph-cluster$ ceph -s
  cluster:
    id:     8dc32c41-121c-49df-9554-dfb7deb8c975
    health: HEALTH_ERR
            Module 'dashboard' has failed: OSError("Port 8080 not free on '::'")

  services:
    mon: 3 daemons, quorum ceph-mon1,ceph-mon2,ceph-mon3 (age 33h)
    mgr: ceph-mgr1(active, since 9m), standbys: ceph-mgr2
    mds: 2/2 daemons up, 2 standby
    osd: 9 osds: 9 up (since 33h), 9 in (since 7d)
    rgw: 2 daemons active (2 hosts, 1 zones)

  data:
    volumes: 1/1 healthy
    pools:   13 pools, 433 pgs
    objects: 843 objects, 1.8 GiB
    usage:   6.2 GiB used, 894 GiB / 900 GiB avail
    pgs:     433 active+clean

cephadmin@ceph-deploy:~/ceph-cluster$ ceph health detail
HEALTH_ERR Module 'dashboard' has failed: OSError("Port 8080 not free on '::'")
[ERR] MGR_MODULE_ERROR: Module 'dashboard' has failed: OSError("Port 8080 not free on '::'")
    Module 'dashboard' has failed: OSError("Port 8080 not free on '::'")
cephadmin@ceph-deploy:~/ceph-cluster$
解决办法:
重启mgr服务
[root@ceph-mgr1 ~]# systemctl restart ceph-mgr@ceph-mgr1.service
或者
[root@ceph-mgr1 ~]# systemctl restart ceph-mgr.target

再次设置dashboard监听地址与端口
cephadmin@ceph-deploy:~/ceph-cluster$ ceph config set mgr mgr/dashboard/ssl false
cephadmin@ceph-deploy:~/ceph-cluster$
cephadmin@ceph-deploy:~/ceph-cluster$ ceph config set mgr mgr/dashboard/ceph-mgr1/server_addr 172.16.88.111
cephadmin@ceph-deploy:~/ceph-cluster$
cephadmin@ceph-deploy:~/ceph-cluster$ ceph config set mgr mgr/dashboard/ceph-mgr1/server
cephadmin@ceph-deploy:~/ceph-cluster$ ceph mgr services
{
    "dashboard": "http://172.16.88.111:9009/"
}
cephadmin@ceph-deploy:~/ceph-cluster$_port 9009
cephadmin@ceph-deploy:~/ceph-cluster$
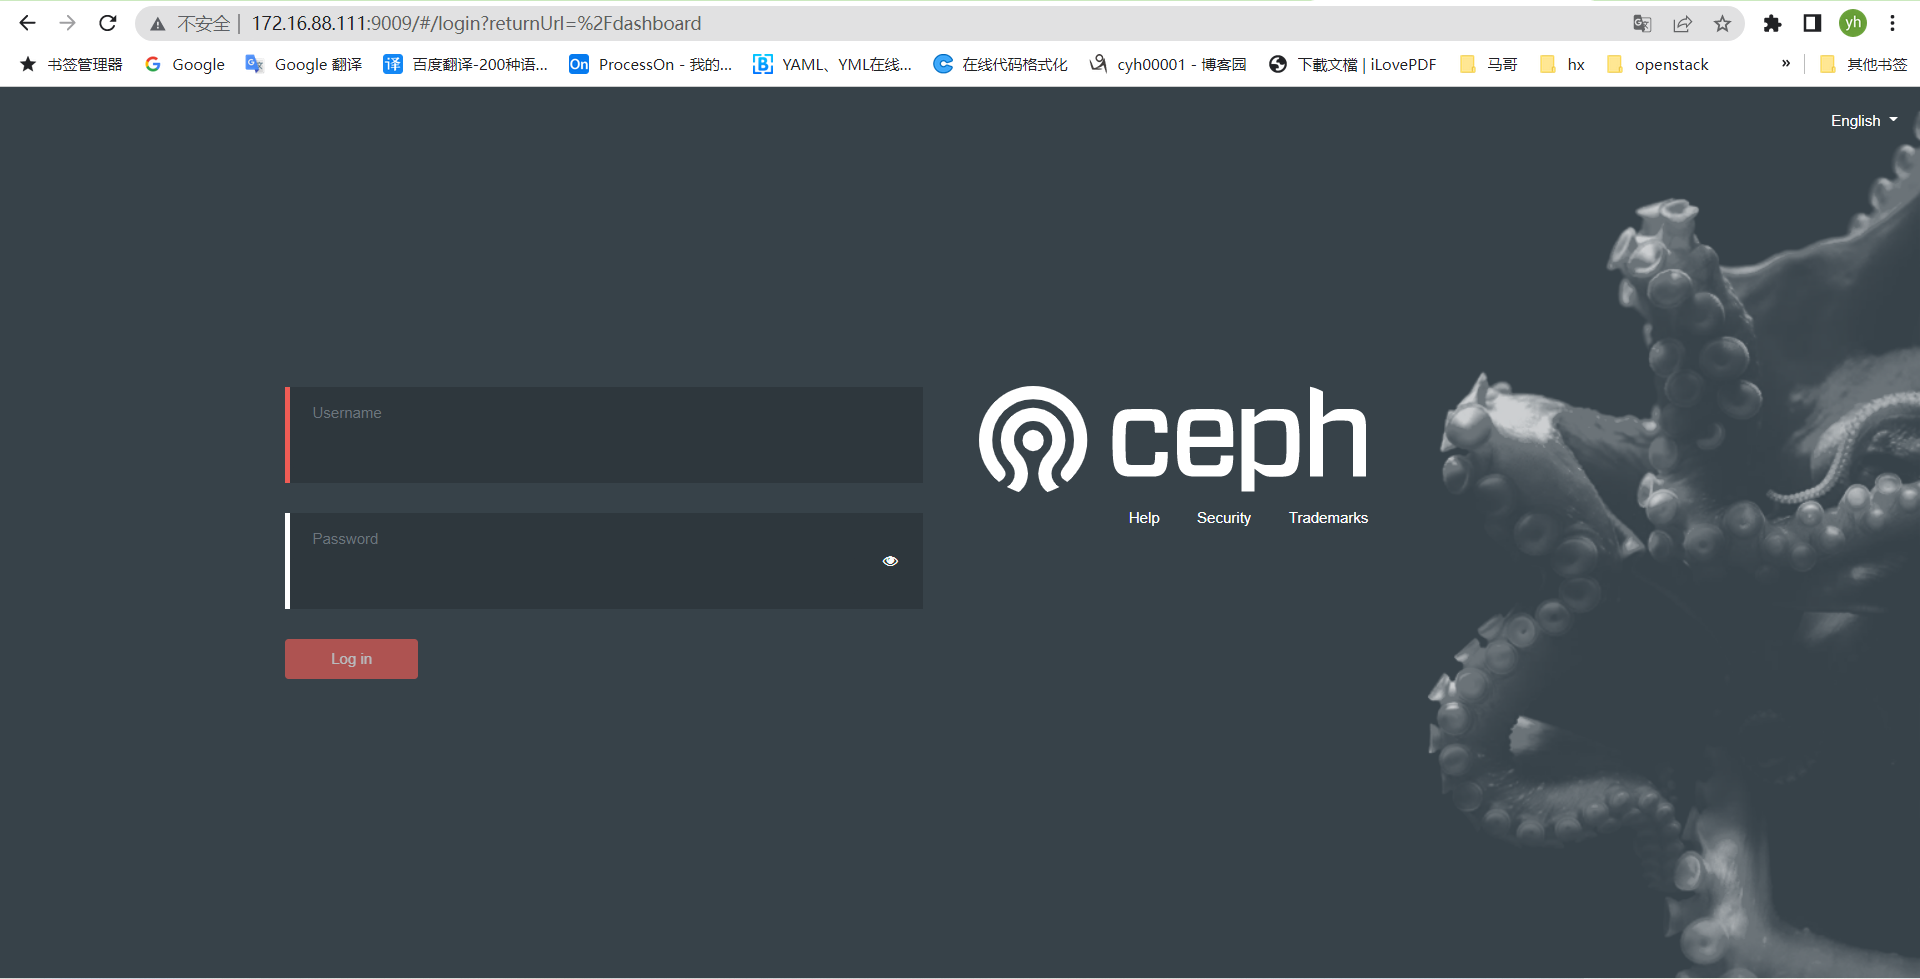
设置 dashboard 账户及密码
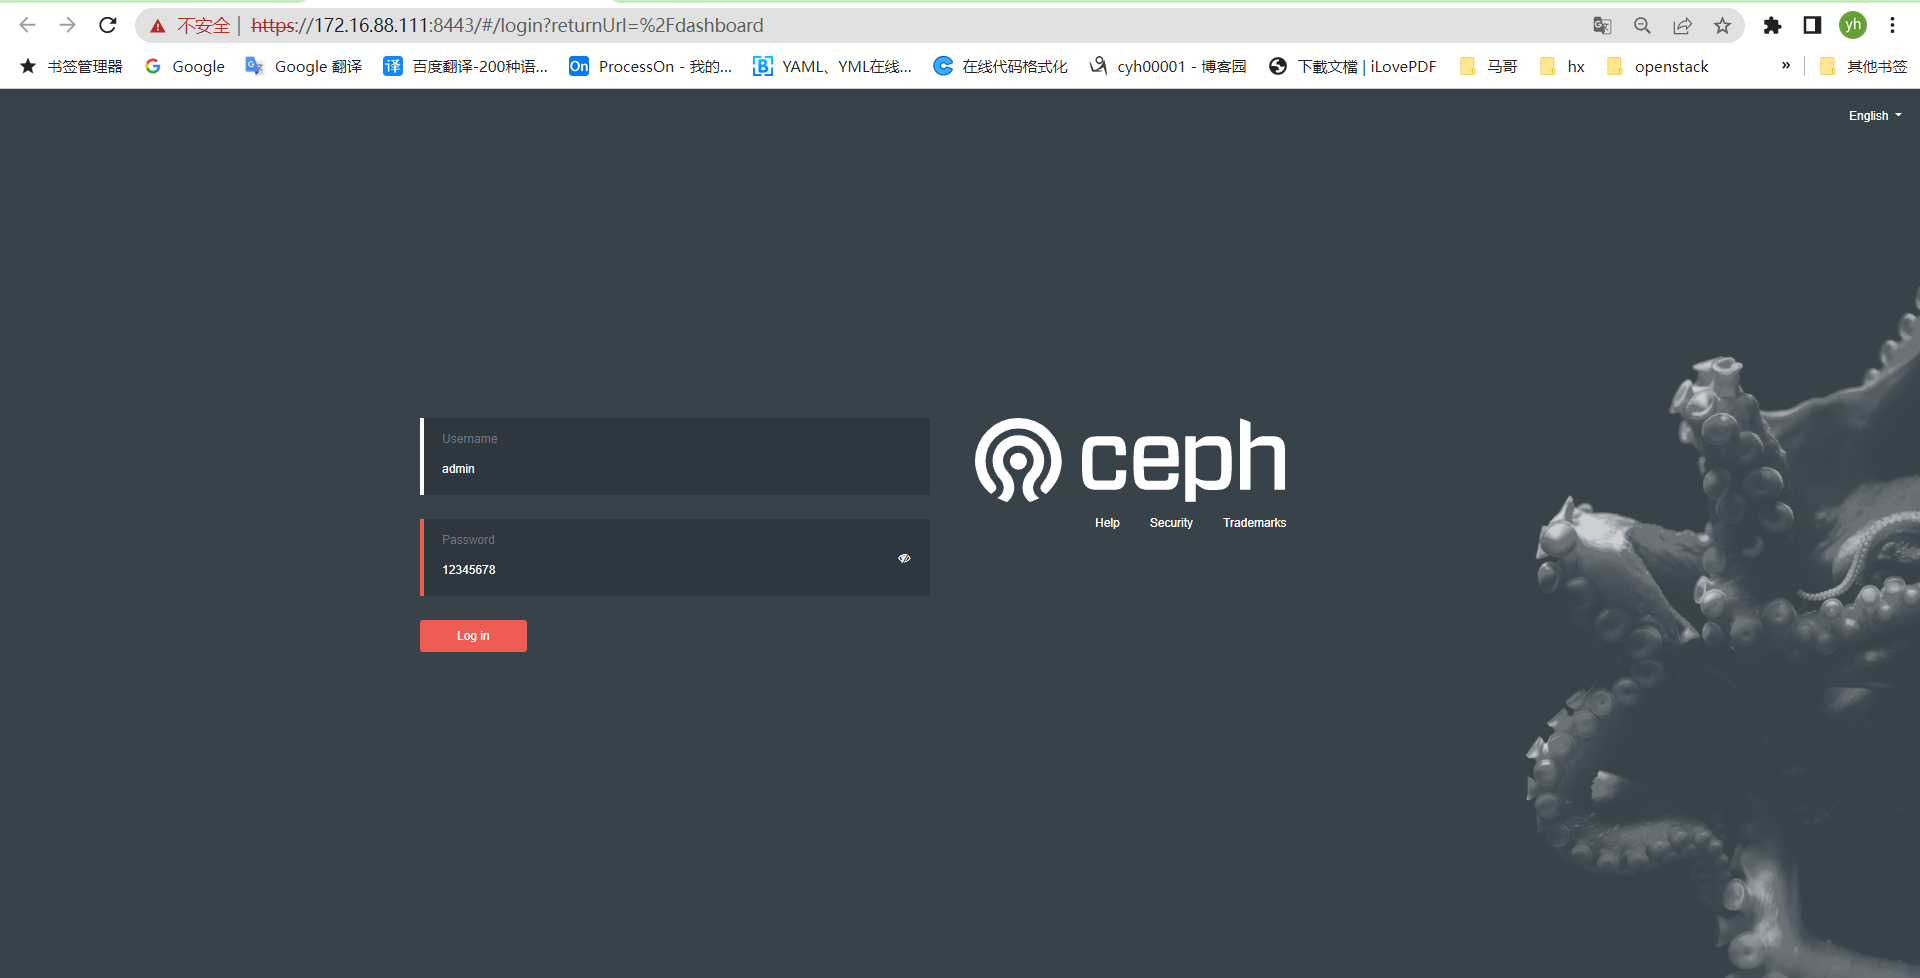
cephadmin@ceph-deploy:~/ceph-cluster$ touch pass.txt
cephadmin@ceph-deploy:~/ceph-cluster$ echo "12345678" > pass.txt
cephadmin@ceph-deploy:~/ceph-cluster$ ceph dashboard set-login-credentials admin -i pass.txt
******************************************************************
***          WARNING: this command is deprecated.              ***
*** Please use the ac-user-* related commands to manage users. ***
******************************************************************
Username and password updated
cephadmin@ceph-deploy:~/ceph-cluster$
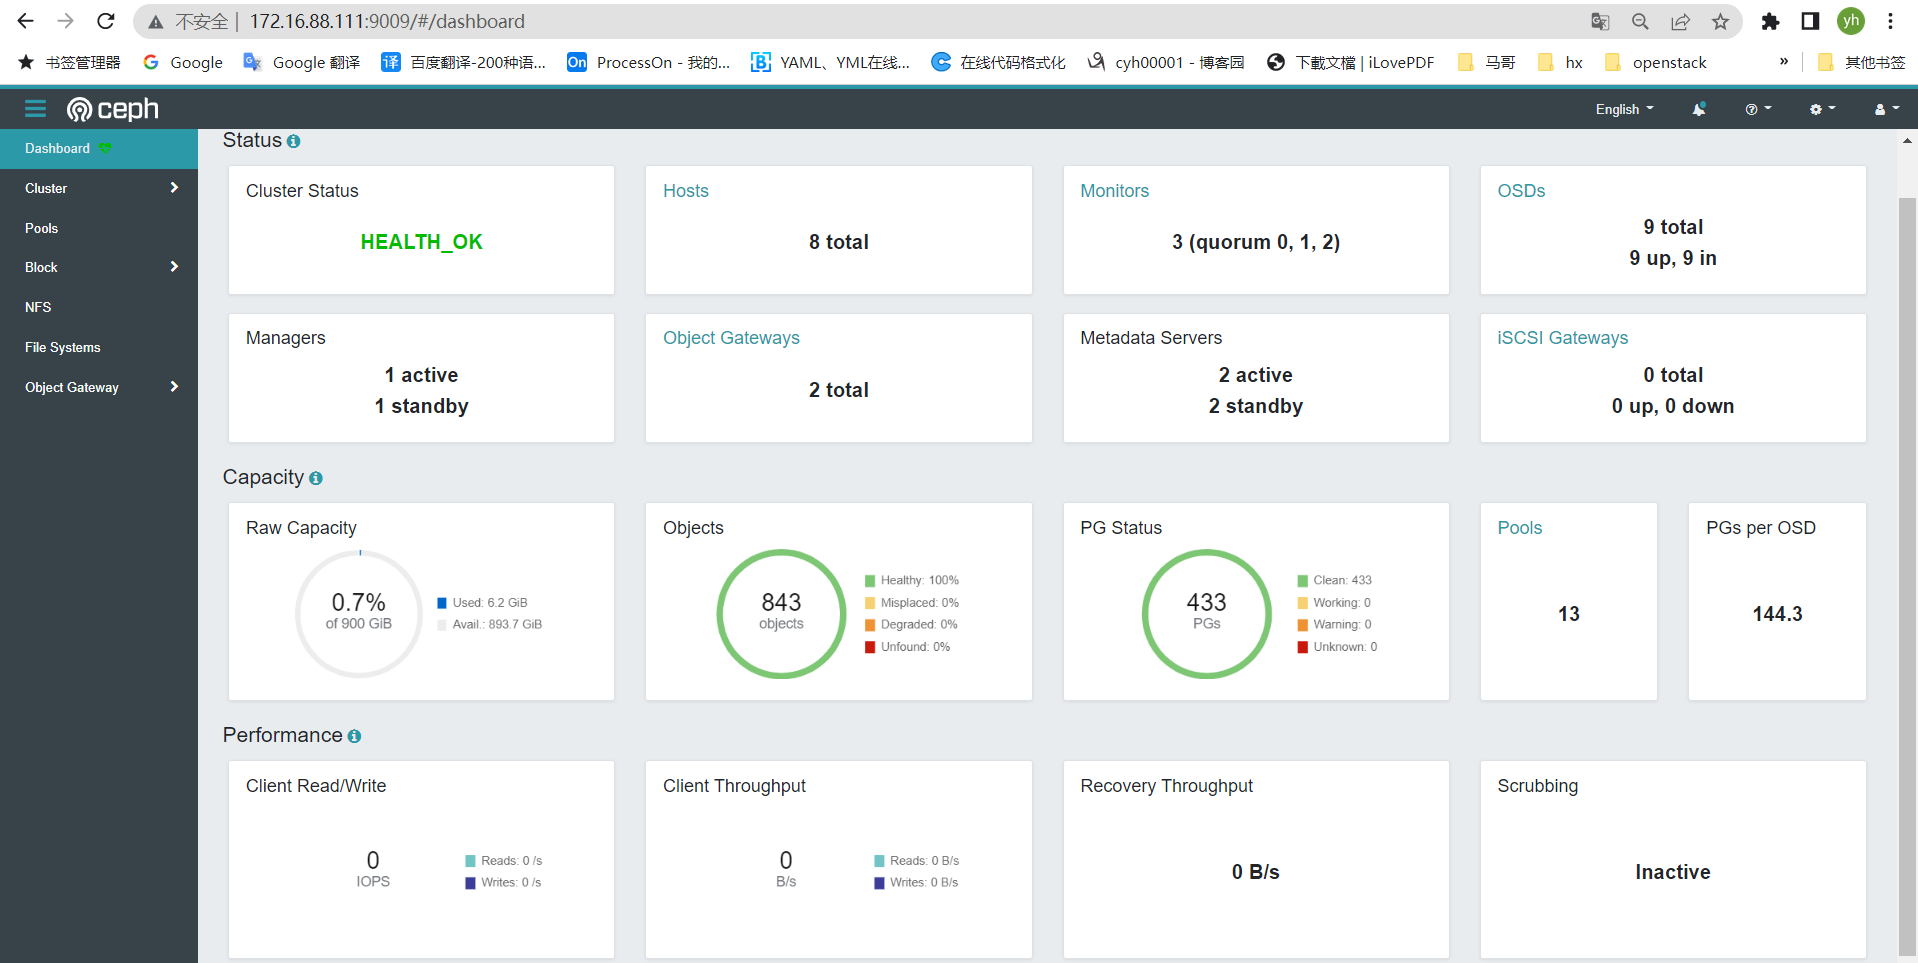
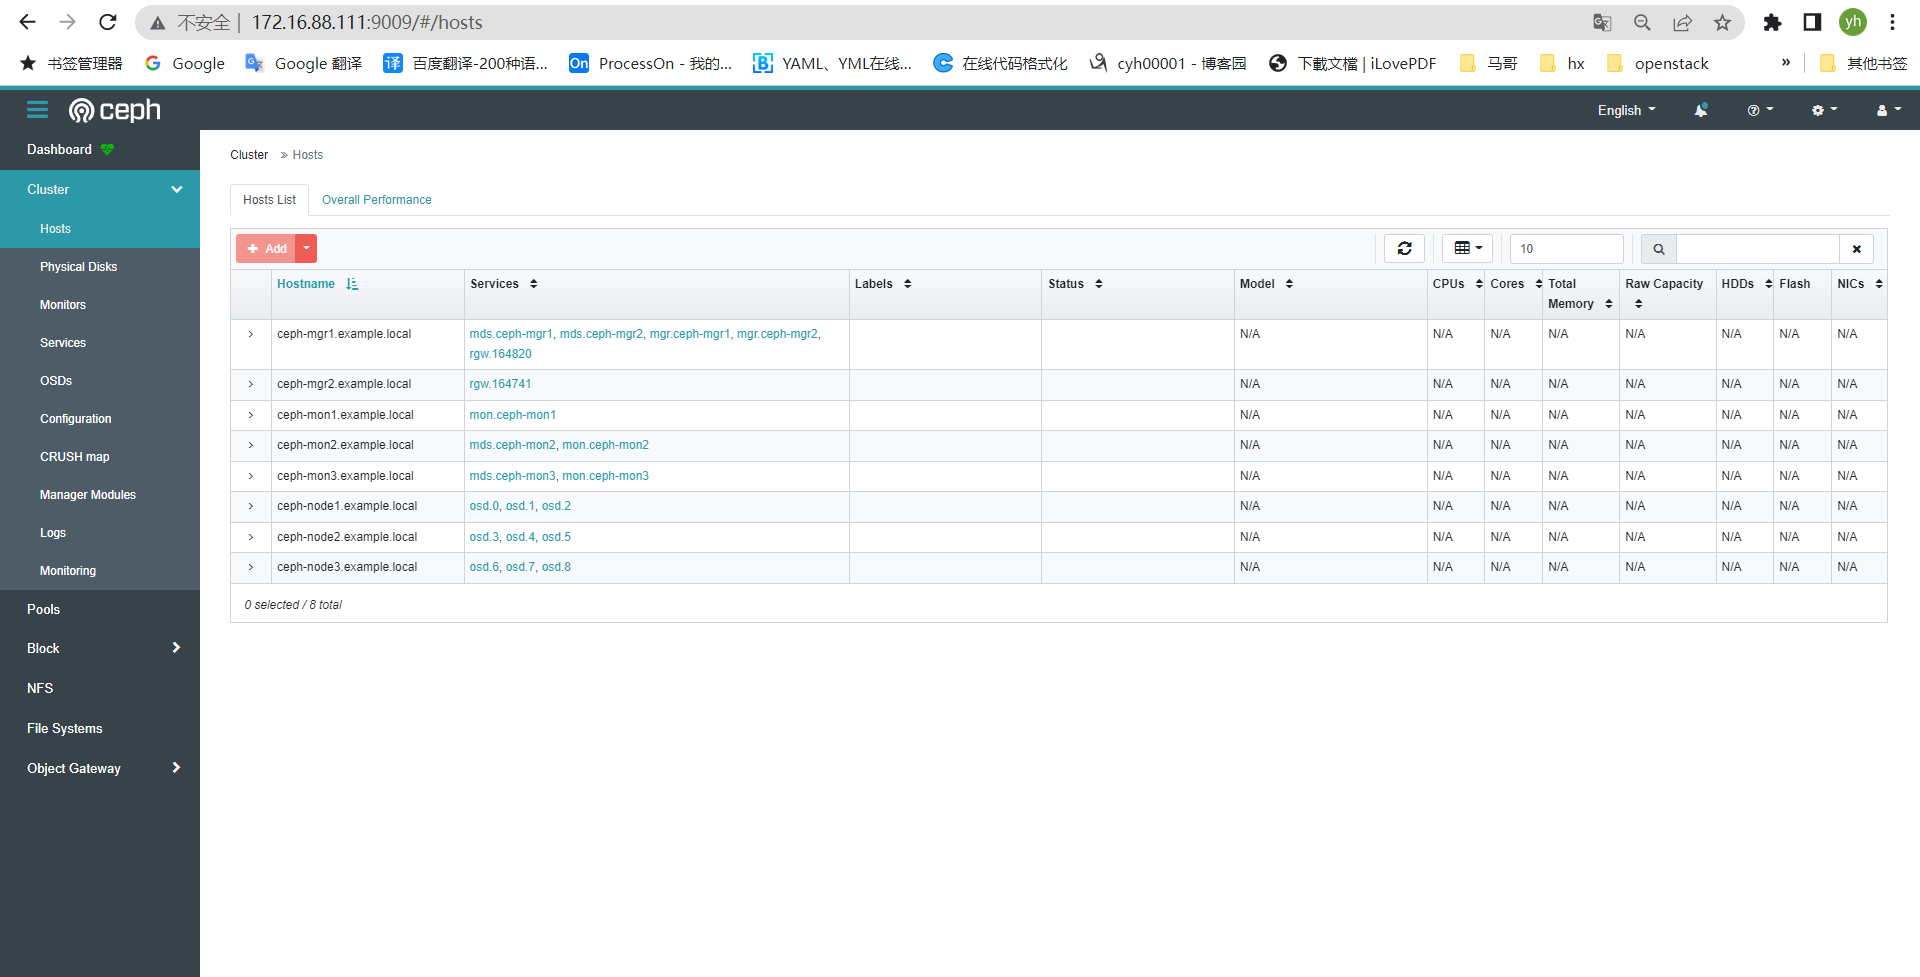
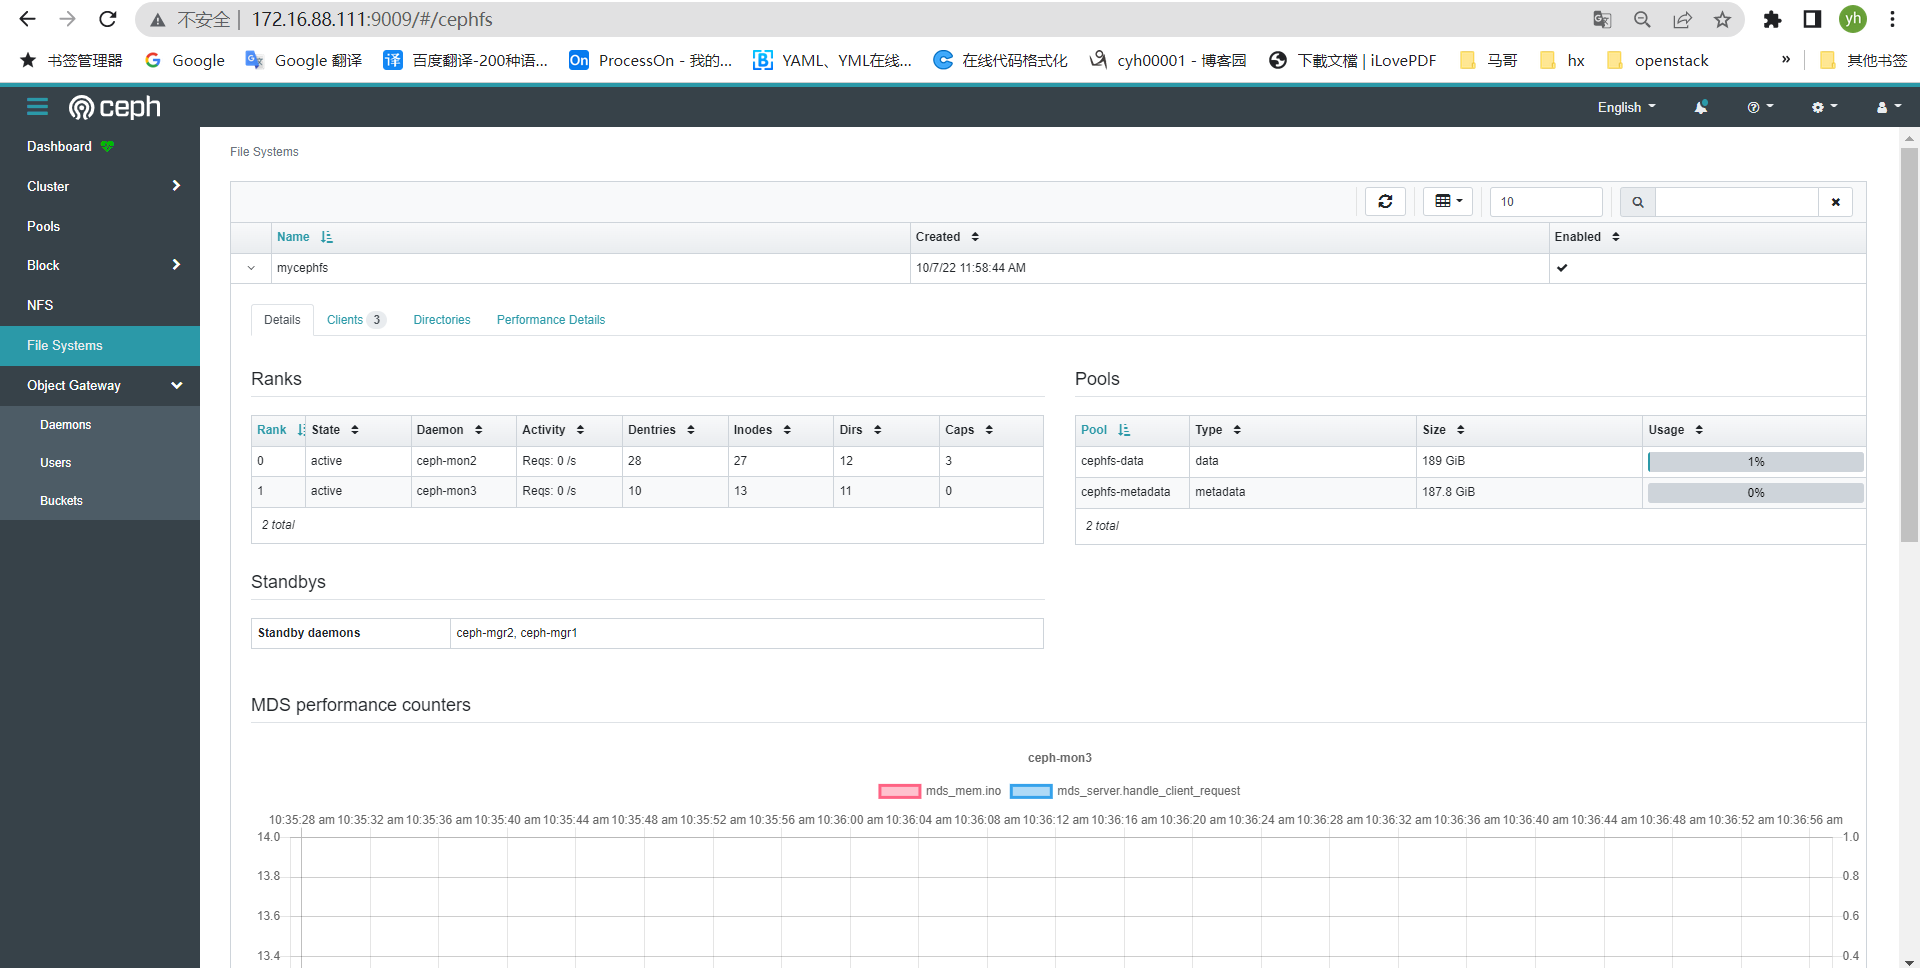
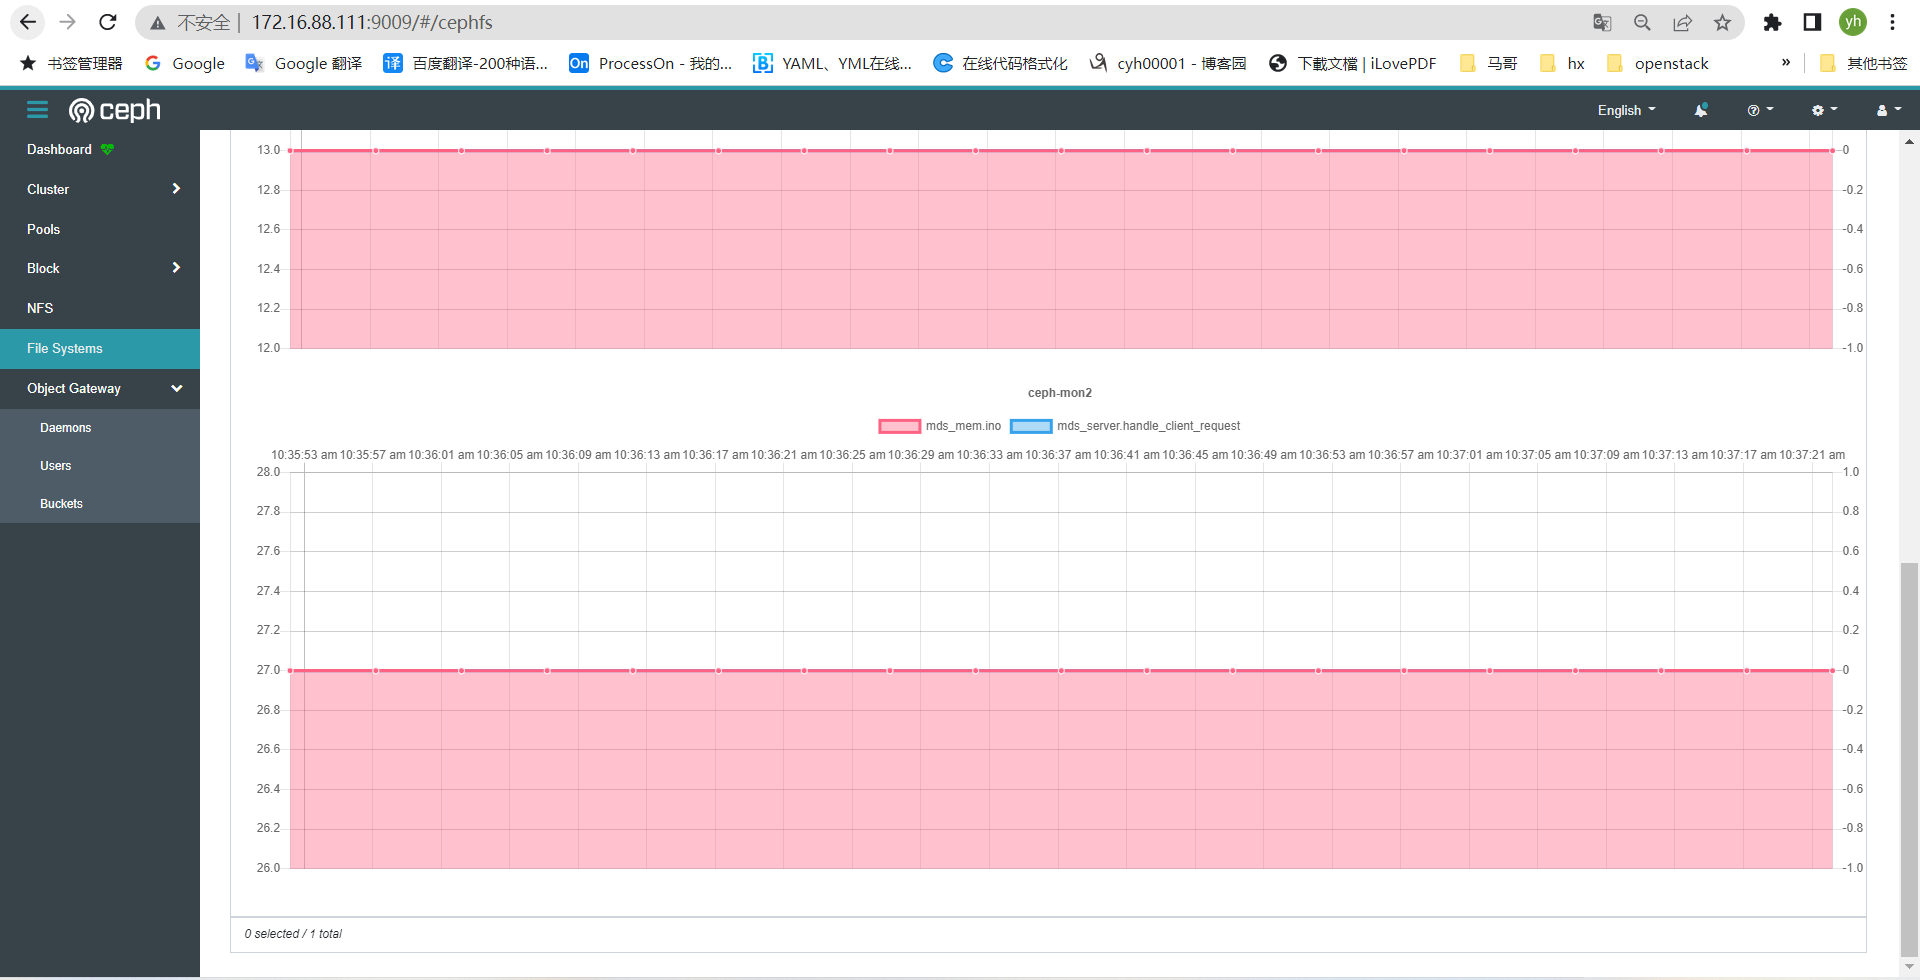
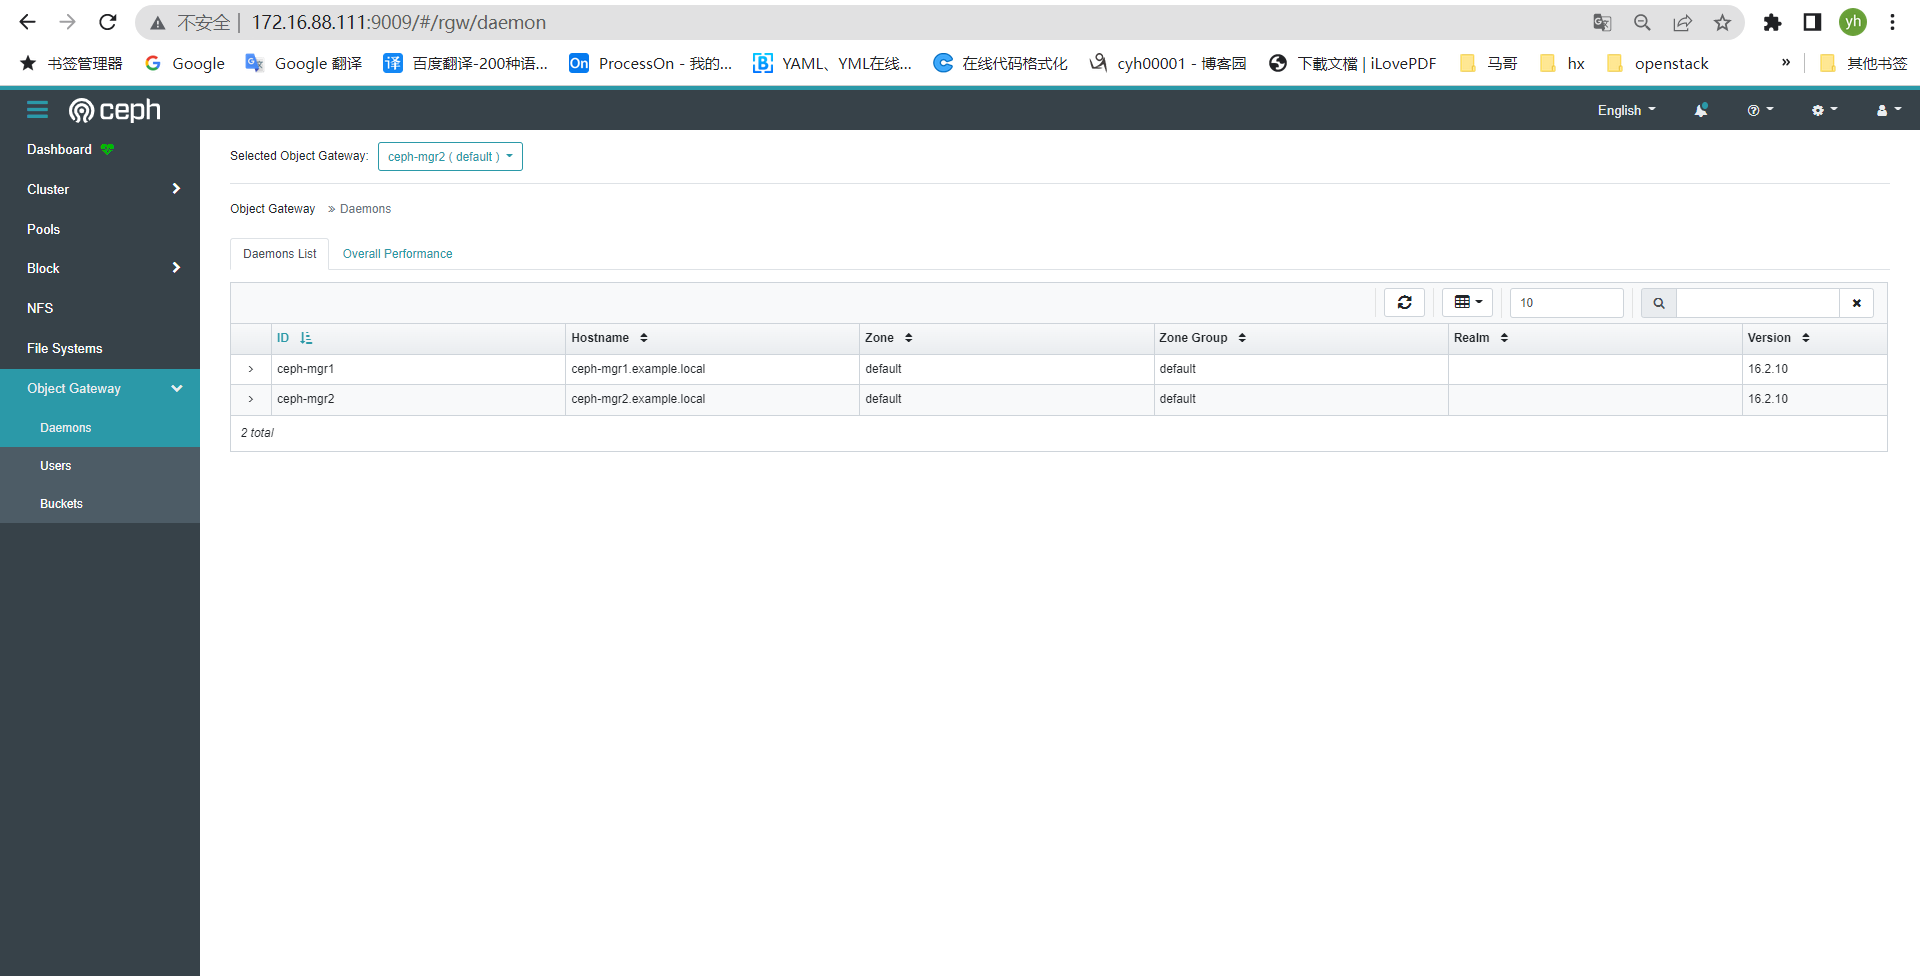
dashboard 验证
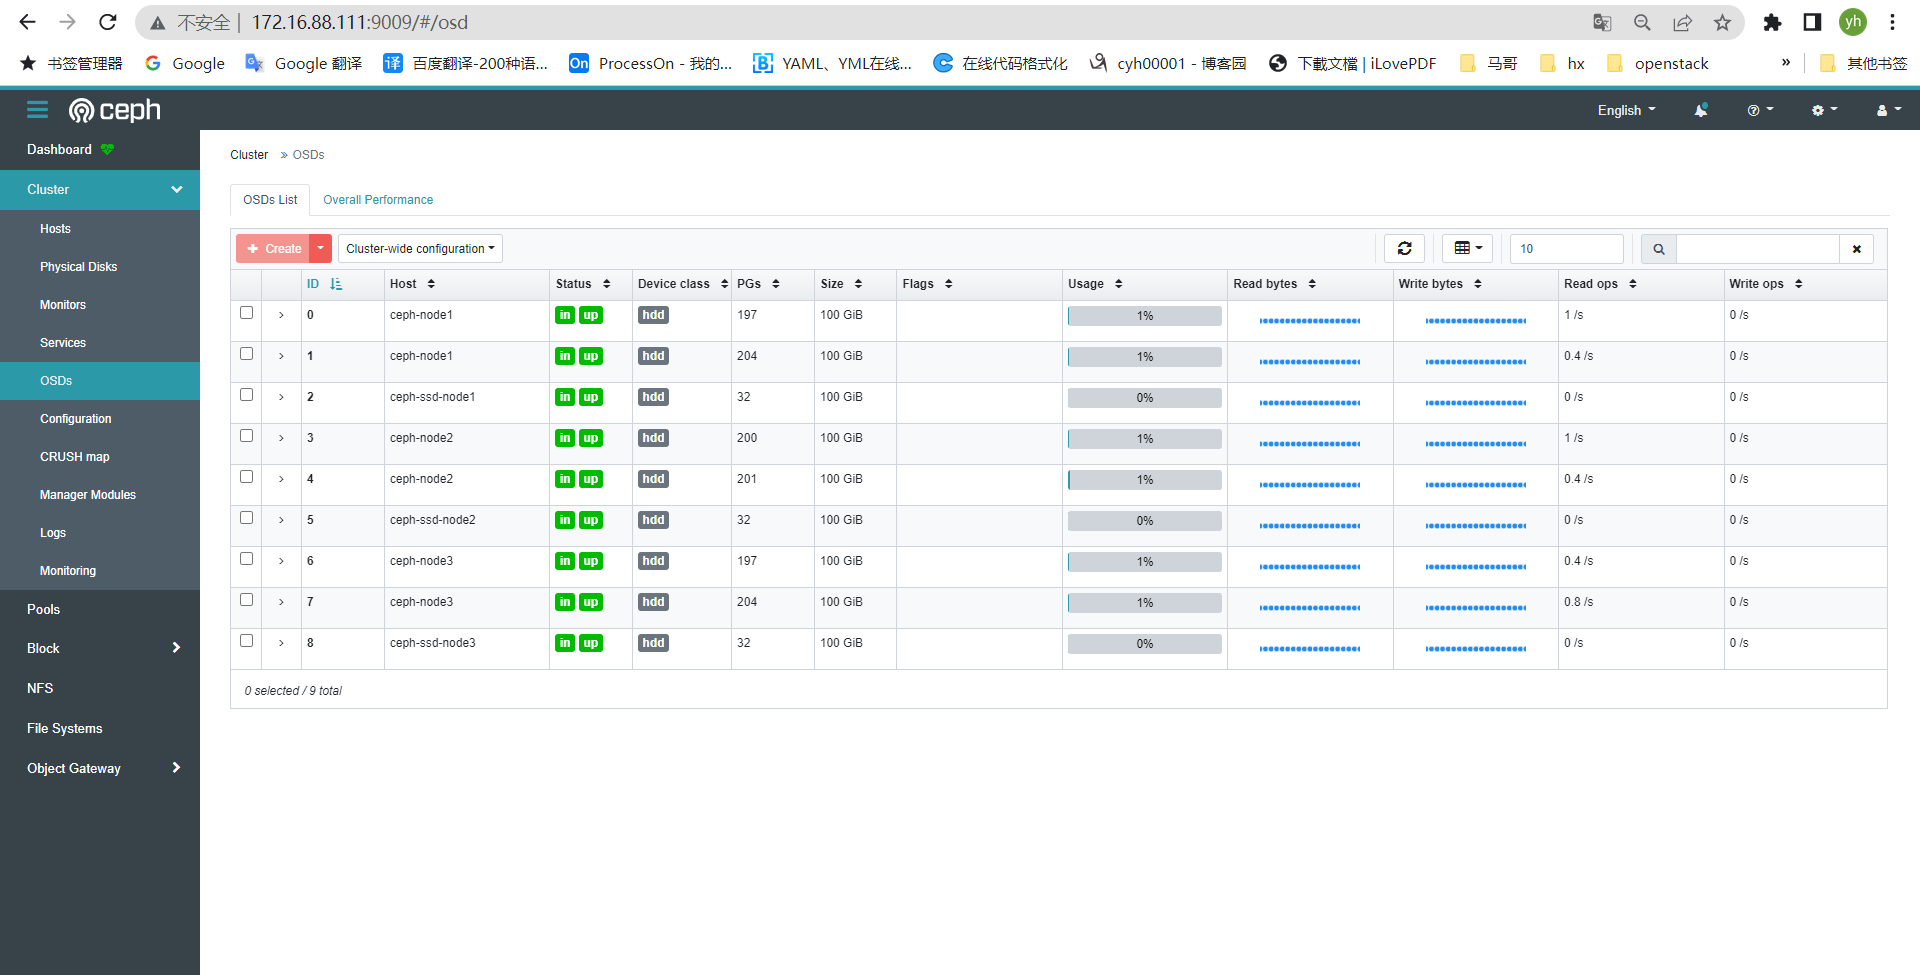
ceph-node节点
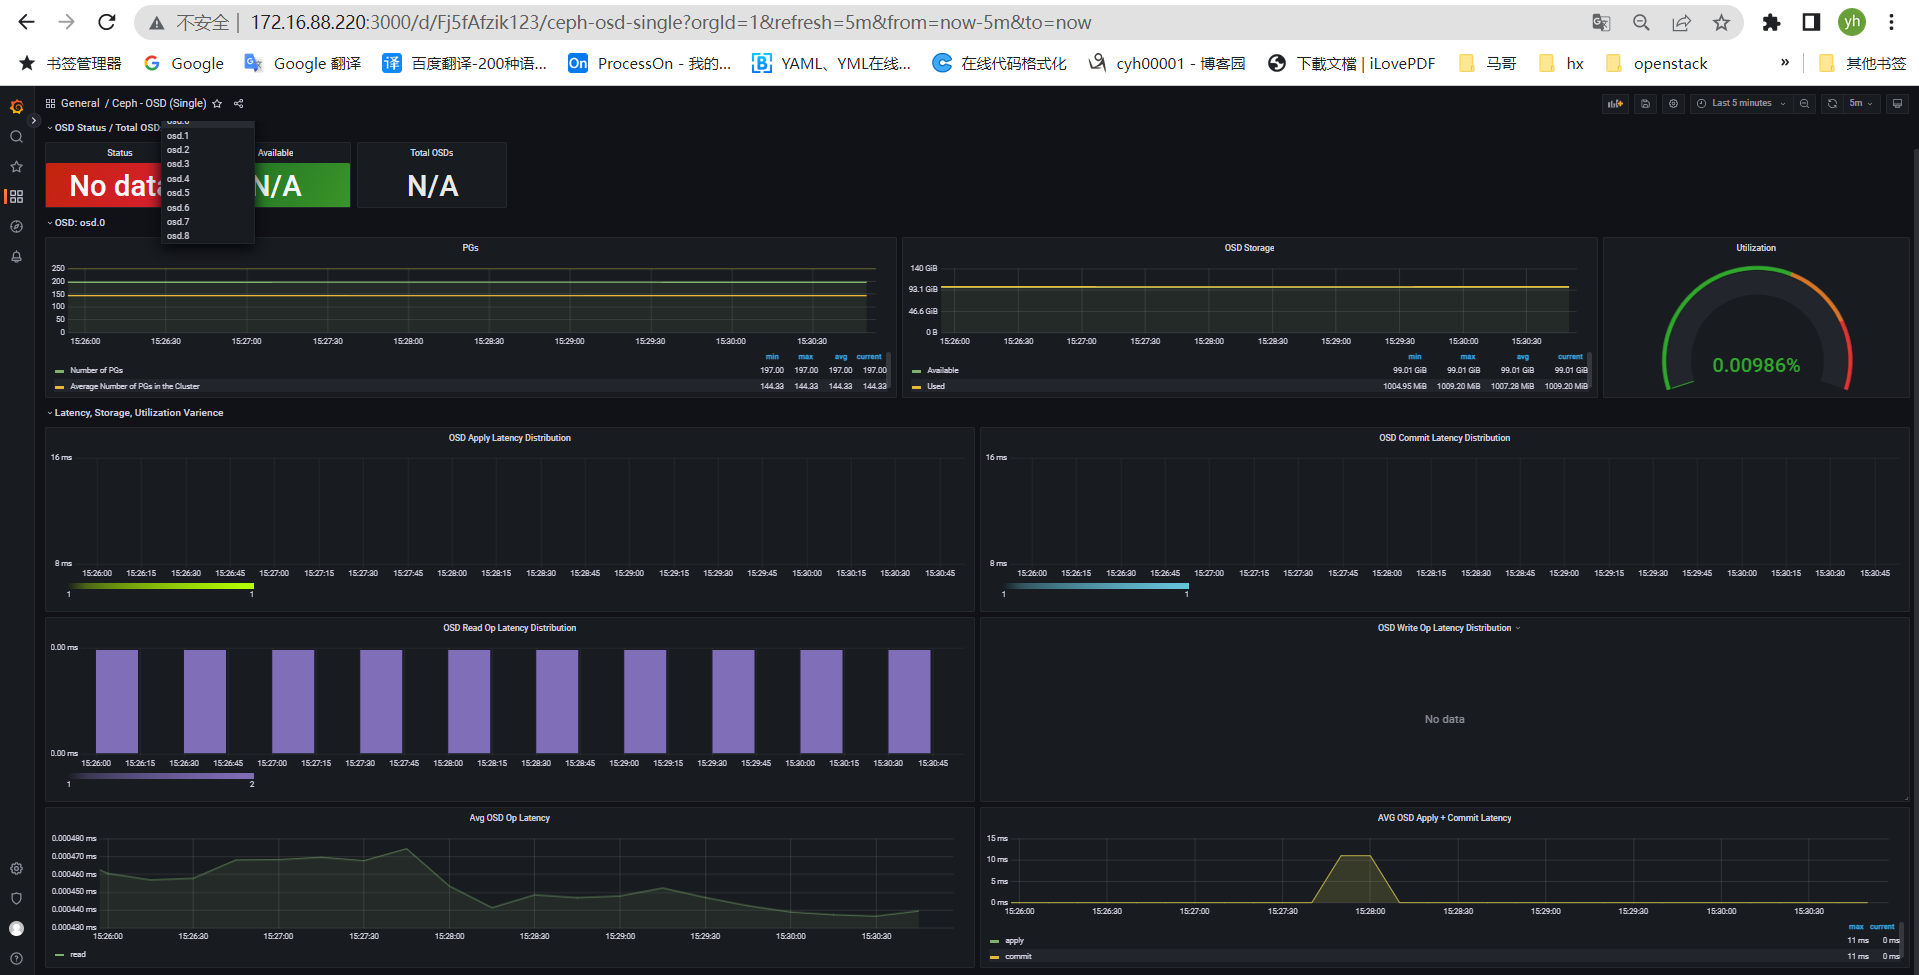
ceph-osd详情
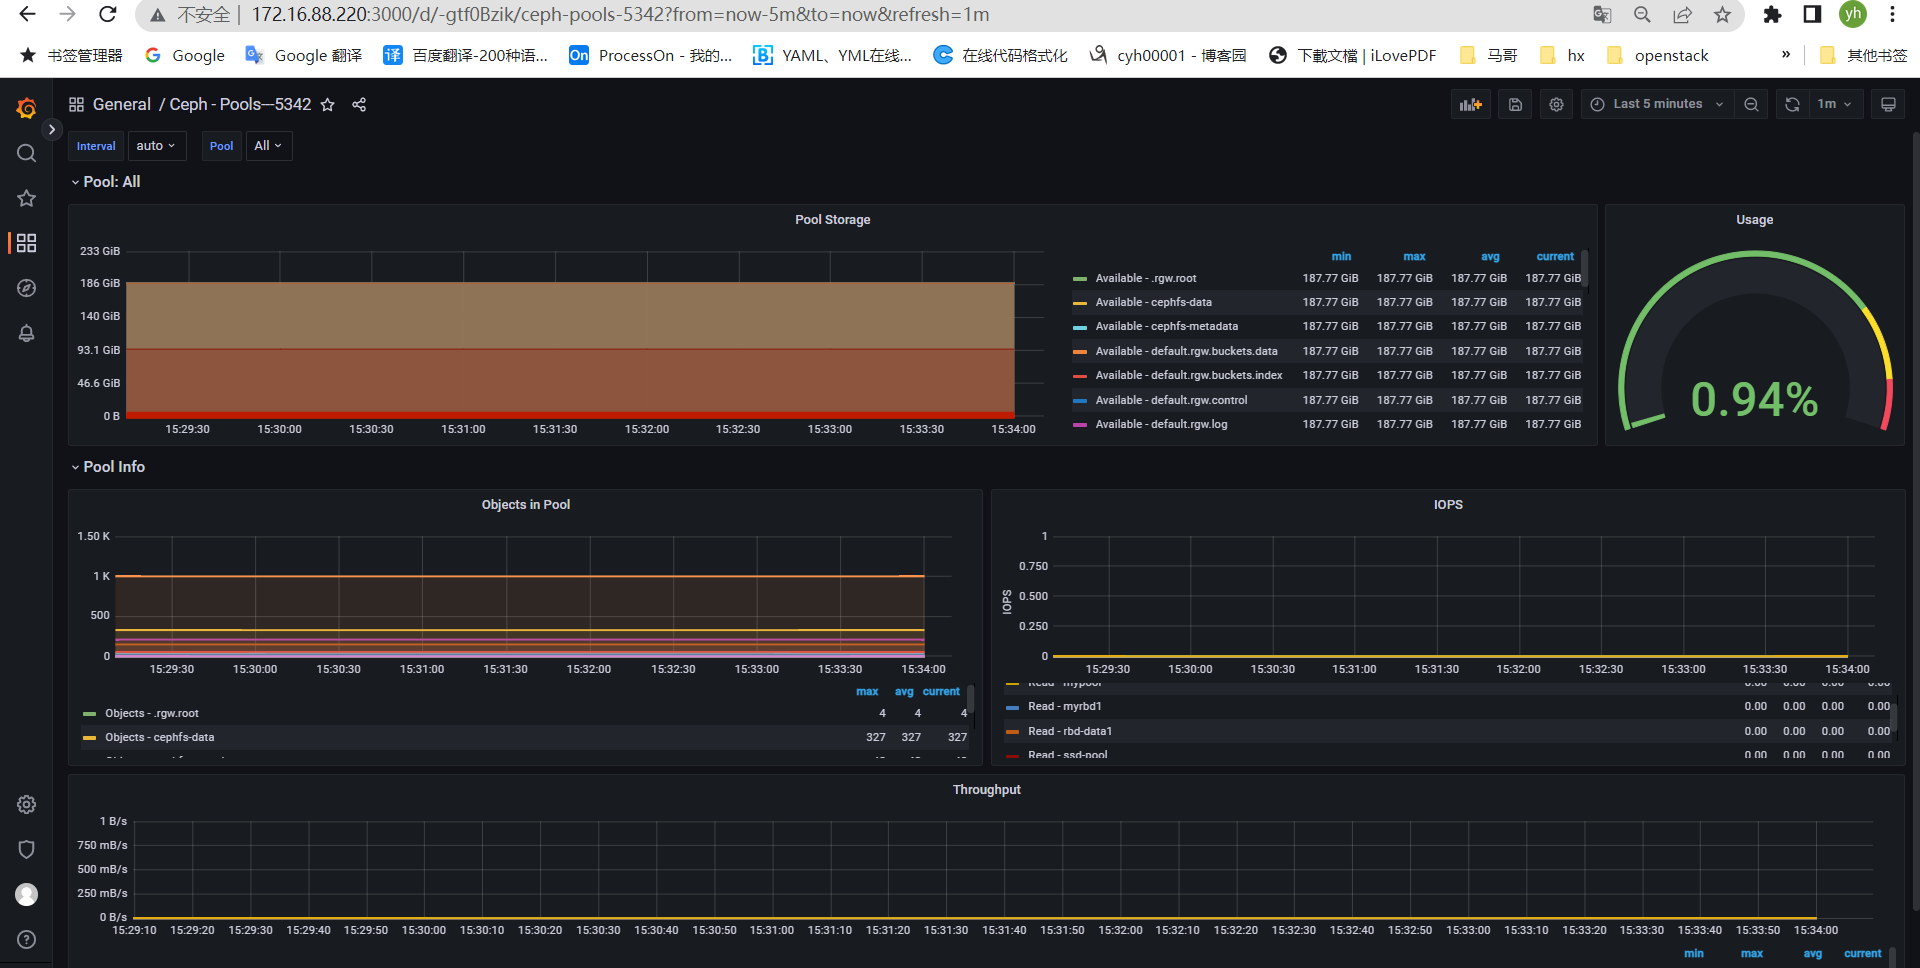
集群pool详情

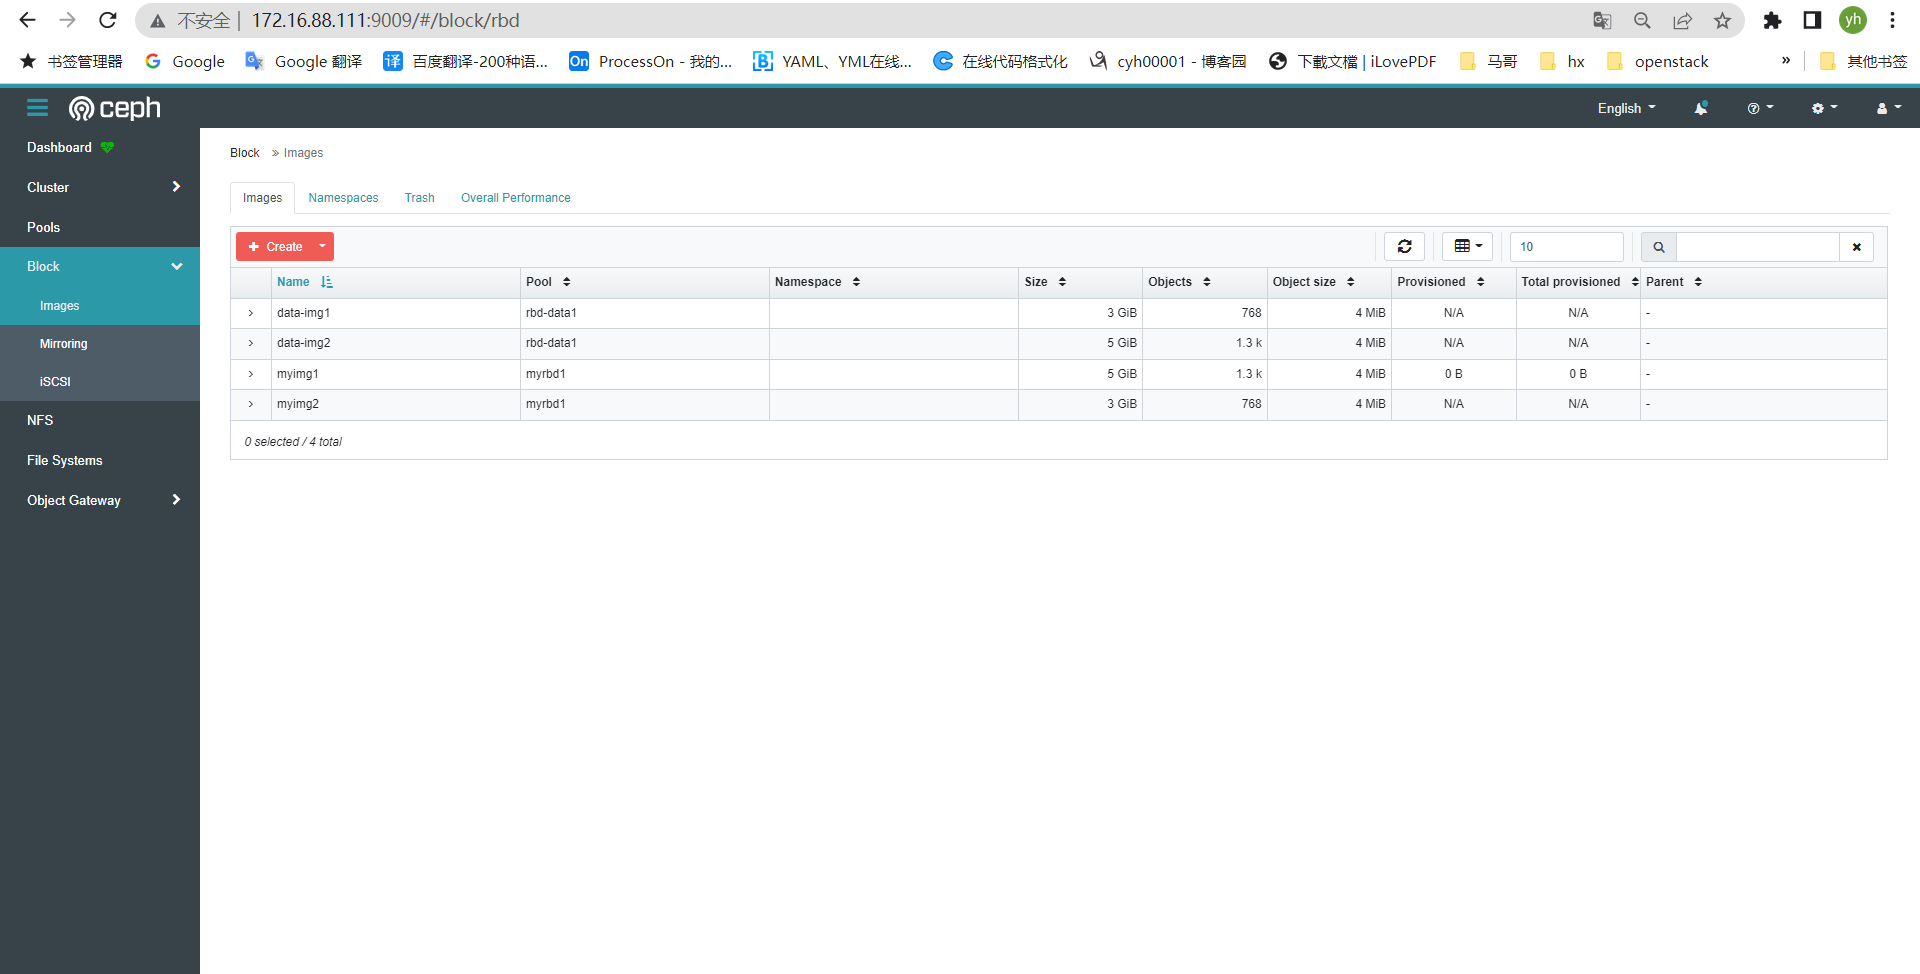
cephfs
radosgw

三、dashboard SSL启用
如果要使用 SSL 访问。 则需要配置签名证书。 证书可以使用 ceph 命令生成, 或是 opessl命令生成。
https://docs.ceph.com/en/latest/mgr/dashboard/
cephadmin@ceph-deploy:~/ceph-cluster$ ceph dashboard create-self-signed-cert #创建证书
Self-signed certificate created
cephadmin@ceph-deploy:~/ceph-cluster$
cephadmin@ceph-deploy:~/ceph-cluster$ ceph config set mgr mgr/dashboard/ssl true #开启ssl认证
cephadmin@ceph-deploy:~/ceph-cluster$
cephadmin@ceph-deploy:~/ceph-cluster$ ceph mgr services
{
    "dashboard": "http://172.16.88.111:9009/"
}
cephadmin@ceph-deploy:~/ceph-cluster$

重启ceph-mgr1服务
[root@ceph-mgr1 ~]# systemctl restart ceph-mgr.target
cephadmin@ceph-deploy:~/ceph-cluster$ ceph mgr services
{
    "dashboard": "https://172.16.88.111:8443/"
}
cephadmin@ceph-deploy:~/ceph-cluster$

四、通过 prometheus监控ceph集群
[root@ceph-mgr1 ~]# mkdir /apps
[root@ceph-mgr1 ~]# cd /apps/
[root@ceph-mgr1 apps]# ls
[root@ceph-mgr1 apps]# wget https://github.com/prometheus/prometheus/releases/download/v2.39.1/prometheus-2.39.1.linux-amd64.tar.gz
[root@ceph-mgr1 apps]# tar -xf prometheus-2.39.1.linux-amd64.tar.gz
[root@ceph-mgr1 apps]# mv prometheus-2.39.1.linux-amd64 prometheus
[root@ceph-mgr1 prometheus]# vi /etc/systemd/system/prometheus.service
[root@ceph-mgr1 prometheus]# cat /etc/systemd/system/prometheus.service
[Unit]
Description=Prometheus Server
Documentation=https://prometheus.io/docs/introduction/overview/
After=network.target

[Service]
Restart=on-failure
WorkingDirectory=/apps/prometheus/
ExecStart=/apps/prometheus/prometheus --config.file=/apps/prometheus/prometheus.yml

[Install]
WantedBy=multi-user.target
[root@ceph-mgr1 prometheus]#
[root@ceph-mgr1 prometheus]# systemctl daemon-reload
[root@ceph-mgr1 prometheus]# systemctl enable --now prometheus.service
部署 node_exporter:
各 node 节点安装 node_exporter
root@easzlab-deploy:~# ansible 'vm' -m shell -a "mkdir /apps"
root@easzlab-deploy:~# mkdir ceph-prometheus
root@easzlab-deploy:~# cd ceph-prometheus/
root@easzlab-deploy:~/ceph-prometheus# vi /etc/systemd/system/node-exporter.service
[Unit]
Description=Prometheus Node Exporter
After=network.target

[Service]
ExecStart=/apps/node_exporter/node_exporter

[Install]
WantedBy=multi-user.target
root@easzlab-deploy:~/ceph-prometheus#
root@easzlab-deploy:~/ceph-prometheus# wget https://github.com/prometheus/node_exporter/releases/download/v1.4.0/node_exporter-1.4.0.linux-amd64.tar.gz
root@easzlab-deploy:~/ceph-prometheus# mv node_exporter-1.4.0.linux-amd64 node_exporter
root@easzlab-deploy:~# ansible 'vm' -m copy -a "src=/root/ceph-prometheus/node_exporter dest=/apps"
root@easzlab-deploy:~# ansible 'vm' -m copy -a "src=/root/ceph-prometheus/node-exporter.service dest=/etc/systemd/system/"
root@easzlab-deploy:~# ansible 'vm' -m shell -a "systemctl daemon-reload && systemctl enable --now node-exporter.service"
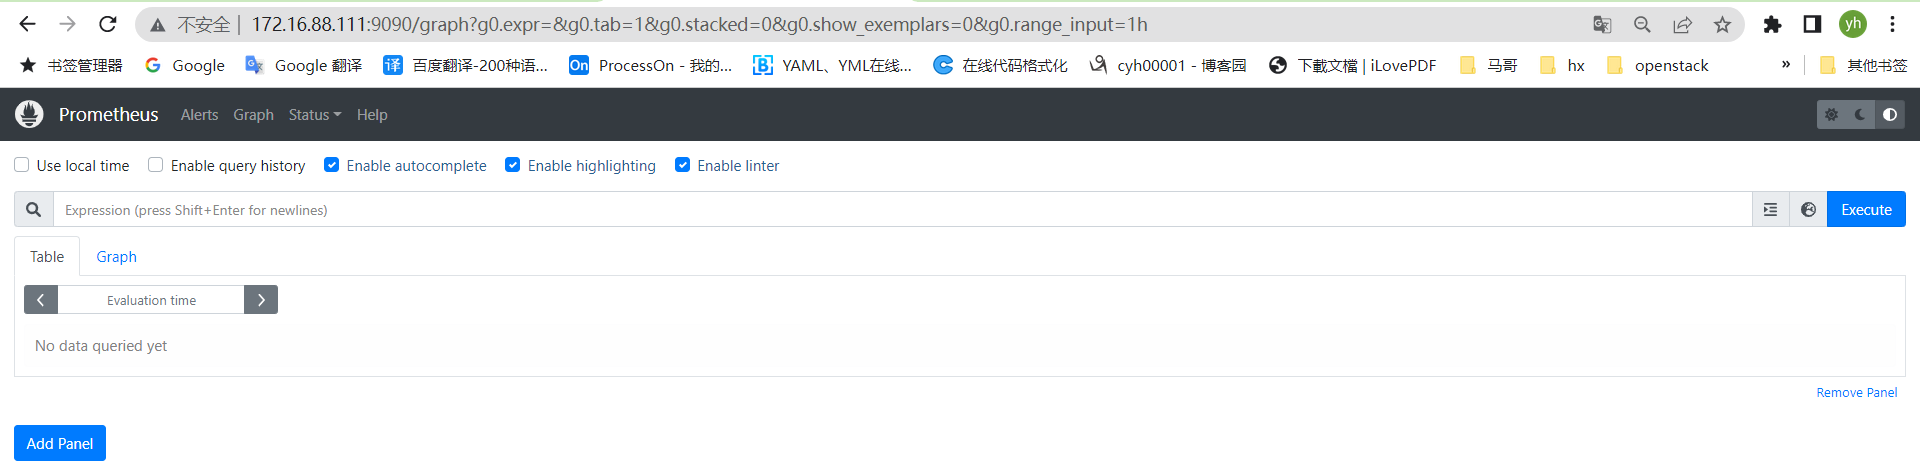
配置 prometheus server 数据并验证
[root@ceph-mgr1 ~]# vim /apps/prometheus/prometheus.yml
[root@ceph-mgr1 ~]# cat /apps/prometheus/prometheus.yml
# my global config
global:
  scrape_interval: 15s # Set the scrape interval to every 15 seconds. Default is every 1 minute.
  evaluation_interval: 15s # Evaluate rules every 15 seconds. The default is every 1 minute.
  # scrape_timeout is set to the global default (10s).

# Alertmanager configuration
alerting:
  alertmanagers:
    - static_configs:
        - targets:
          # - alertmanager:9093

# Load rules once and periodically evaluate them according to the global 'evaluation_interval'.
rule_files:
  # - "first_rules.yml"
  # - "second_rules.yml"

# A scrape configuration containing exactly one endpoint to scrape:
# Here it's Prometheus itself.
scrape_configs:
  # The job name is added as a label `job=<job_name>` to any timeseries scraped from this config.
  - job_name: "prometheus"

    # metrics_path defaults to '/metrics'
    # scheme defaults to 'http'.

    static_configs:
      - targets: ["localhost:9090"]

  - job_name: 'ceph-node-data'
    static_configs:
      - targets: ['172.16.88.121:9100','172.16.88.122:9100','172.16.88.123:9100']
[root@ceph-mgr1 ~]#
[root@ceph-mgr1 ~]# cd /apps/prometheus/
[root@ceph-mgr1 prometheus]# ./promtool check prometheus.yml
promtool: error: expected command but got "prometheus.yml", try --help
[root@ceph-mgr1 prometheus]# ./promtool check config prometheus.yml
Checking prometheus.yml
 SUCCESS: prometheus.yml is valid prometheus config file syntax

[root@ceph-mgr1 prometheus]#
[root@ceph-mgr1 prometheus]# systemctl restart prometheus.service

通过 prometheus 监控 ceph 服务:
Ceph manager 内部的模块中包含了 prometheus 的监控模块,并监听在每个 manager 节点的 9283 端口, 该端口用于将采集到的信息通过 http 接口向 prometheus 提供数据。
https://docs.ceph.com/en/mimic/mgr/prometheus/?highlight=prometheus
启用 prometheus 监控模块
[root@ceph-deploy ~]# ceph mgr module enable prometheus
[root@ceph-deploy ~]#

验证 manager 数据

配置 prometheus 采集数据
[root@ceph-mgr1 prometheus]# vi prometheus.yml
[root@ceph-mgr1 prometheus]# cat prometheus.yml
# my global config
global:
  scrape_interval: 15s # Set the scrape interval to every 15 seconds. Default is every 1 minute.
  evaluation_interval: 15s # Evaluate rules every 15 seconds. The default is every 1 minute.
  # scrape_timeout is set to the global default (10s).

# Alertmanager configuration
alerting:
  alertmanagers:
    - static_configs:
        - targets:
          # - alertmanager:9093

# Load rules once and periodically evaluate them according to the global 'evaluation_interval'.
rule_files:
  # - "first_rules.yml"
  # - "second_rules.yml"

# A scrape configuration containing exactly one endpoint to scrape:
# Here it's Prometheus itself.
scrape_configs:
  # The job name is added as a label `job=<job_name>` to any timeseries scraped from this config.
  - job_name: "prometheus"

    # metrics_path defaults to '/metrics'
    # scheme defaults to 'http'.

    static_configs:
      - targets: ["localhost:9090"]

  - job_name: 'ceph-node-data'
    static_configs:
      - targets: ['172.16.88.121:9100','172.16.88.122:9100','172.16.88.123:9100']

  - job_name: 'ceph-cluster-data'
    static_configs:
      - targets: ['172.16.88.111:9283']
[root@ceph-mgr1 prometheus]#
[root@ceph-mgr1 prometheus]#
[root@ceph-mgr1 prometheus]# ./promtool check config prometheus.yml
Checking prometheus.yml
 SUCCESS: prometheus.yml is valid prometheus config file syntax

[root@ceph-mgr1 prometheus]# systemctl restart prometheus.service
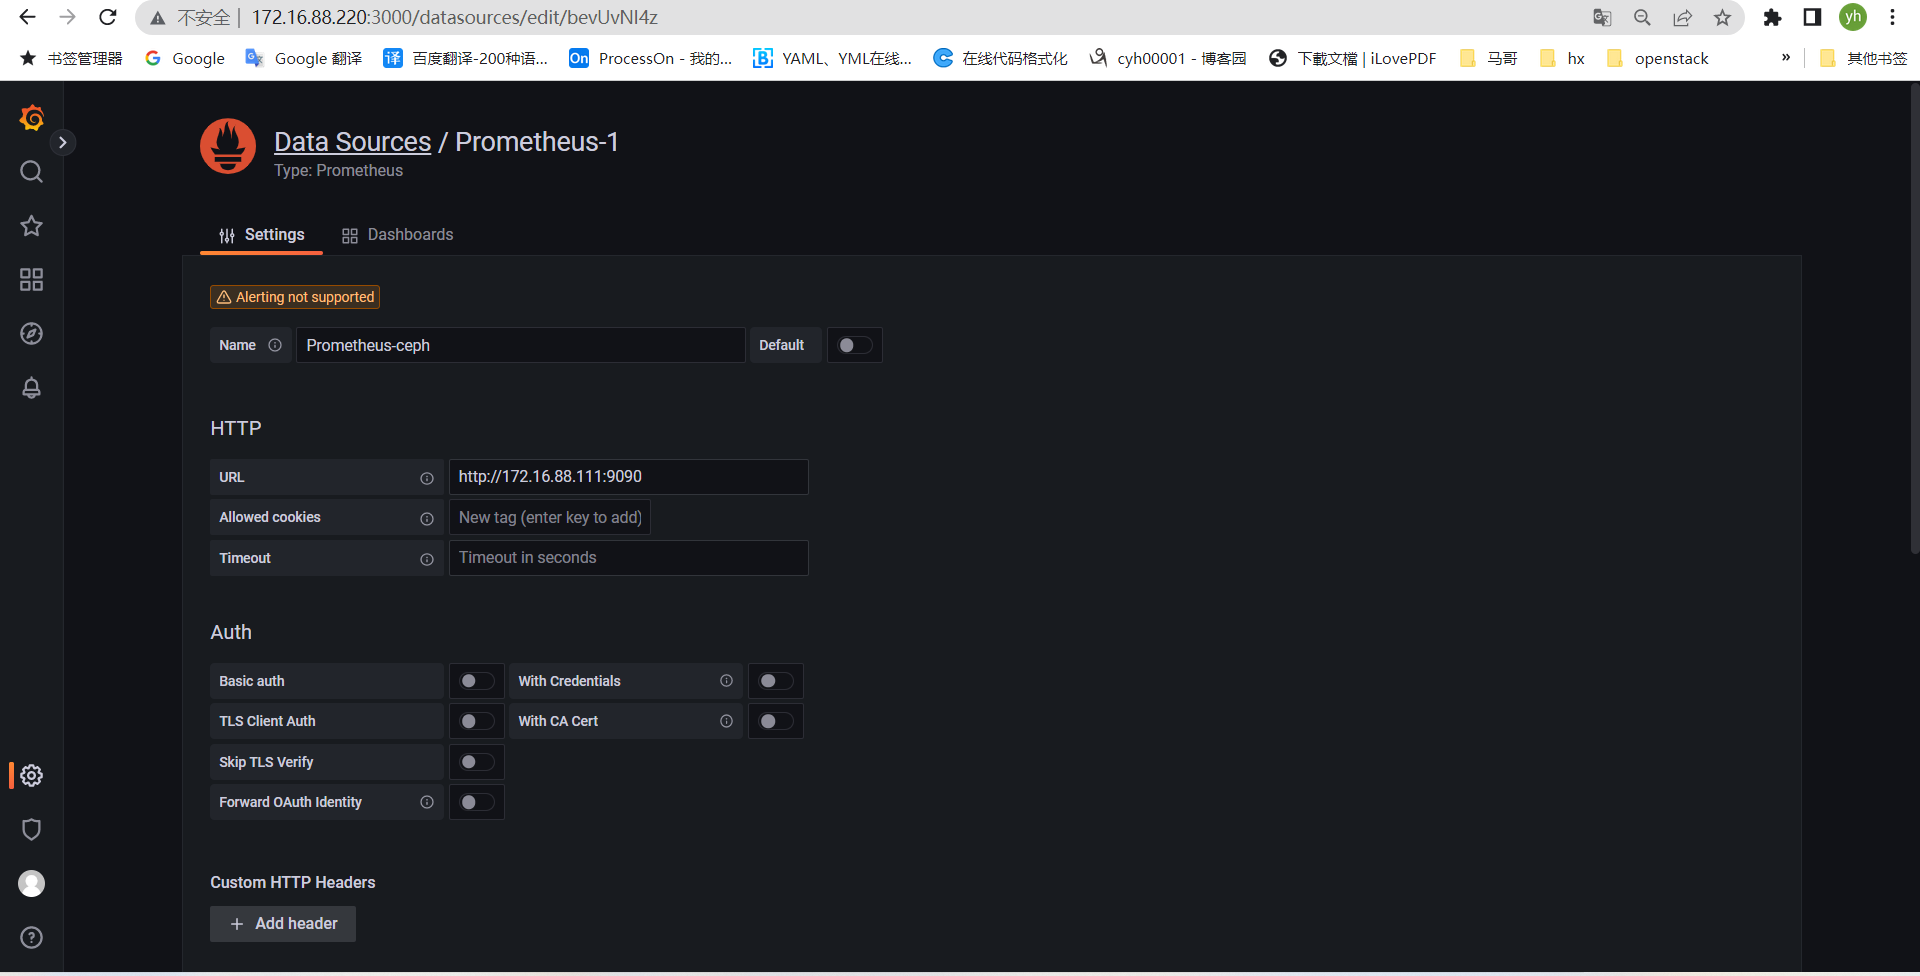
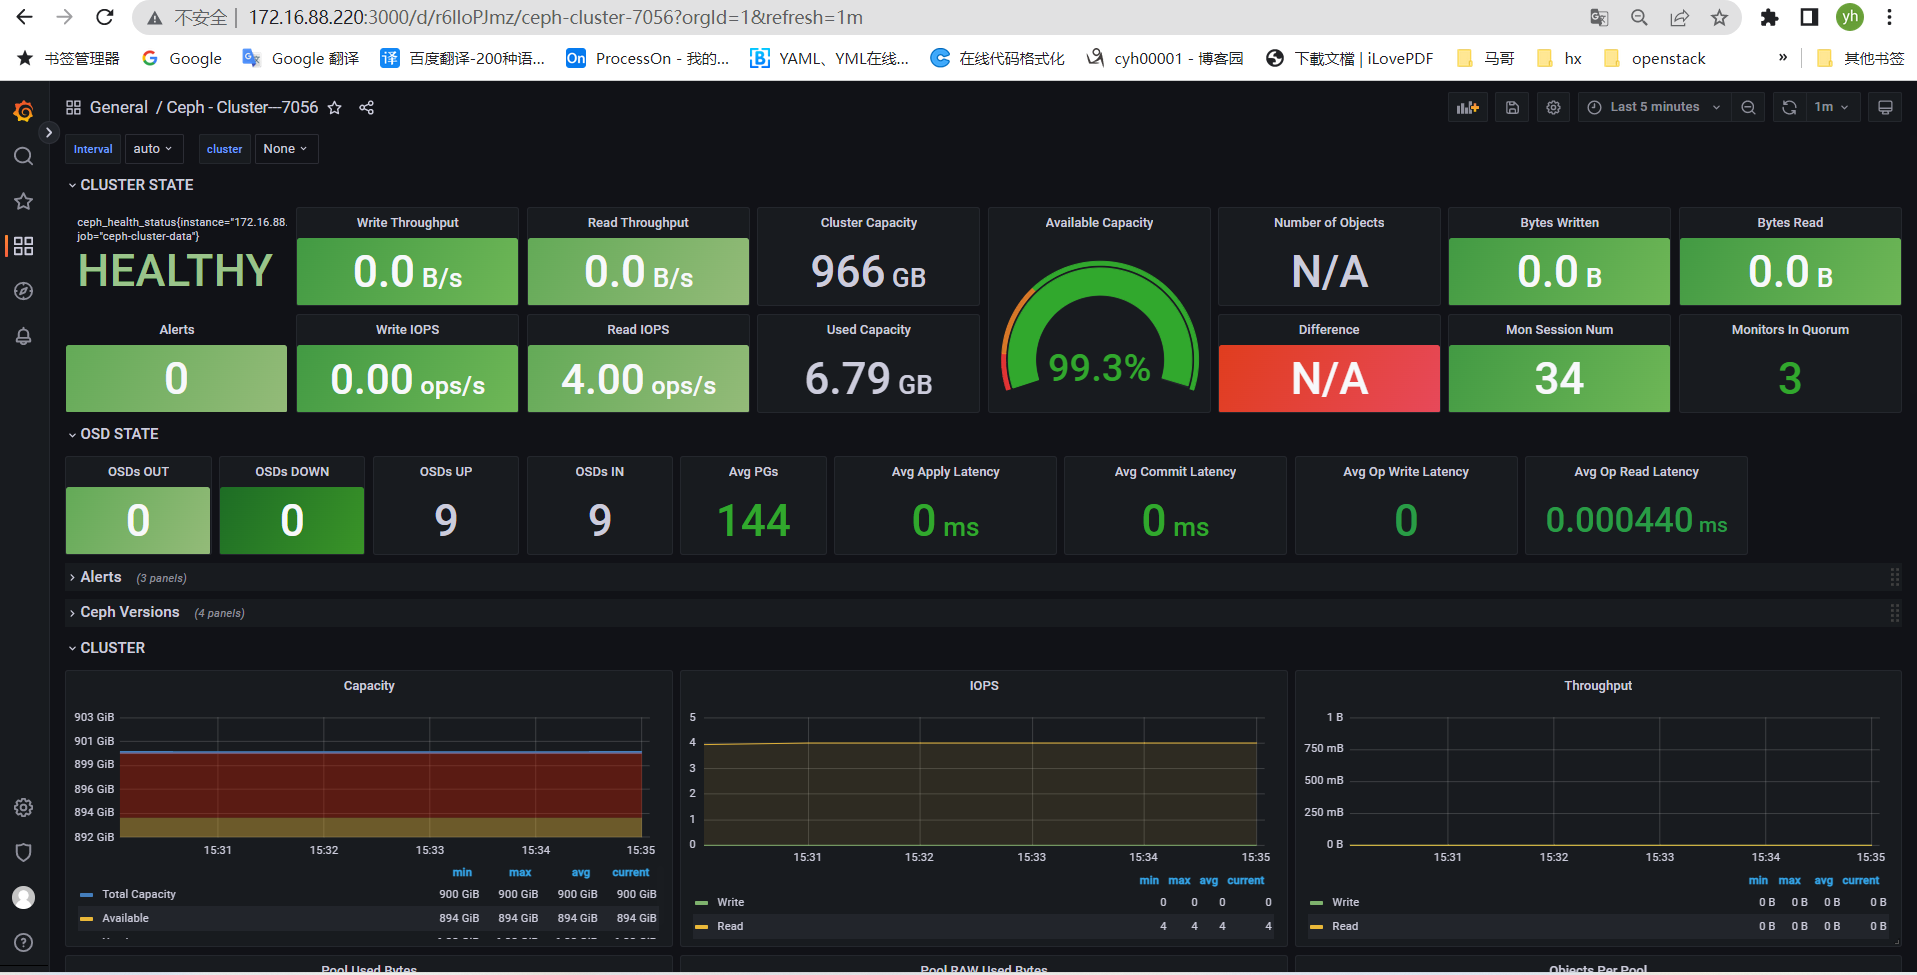
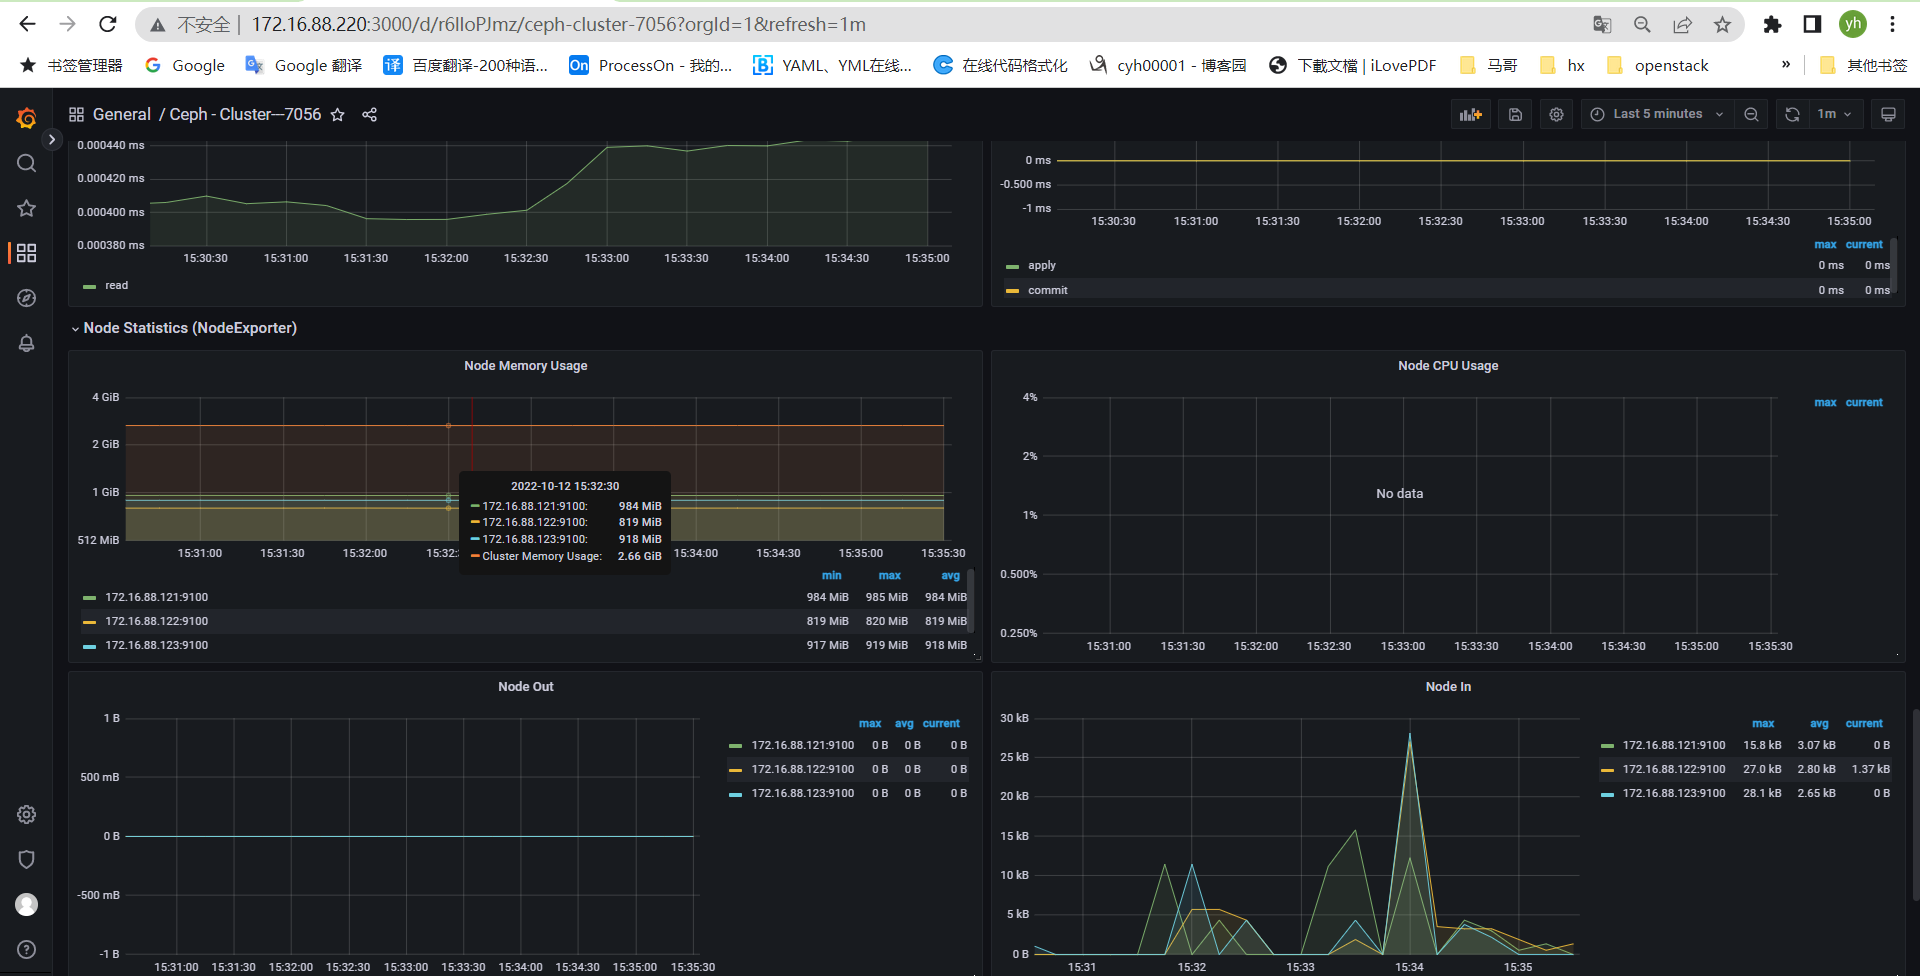
通过 granfana 显示对 ceph 的集群监控数据及 node 数据
安装略
dpkg -i grafana-enterprise_8.5.6_amd64.deb
systemctl enable --now grafana-server
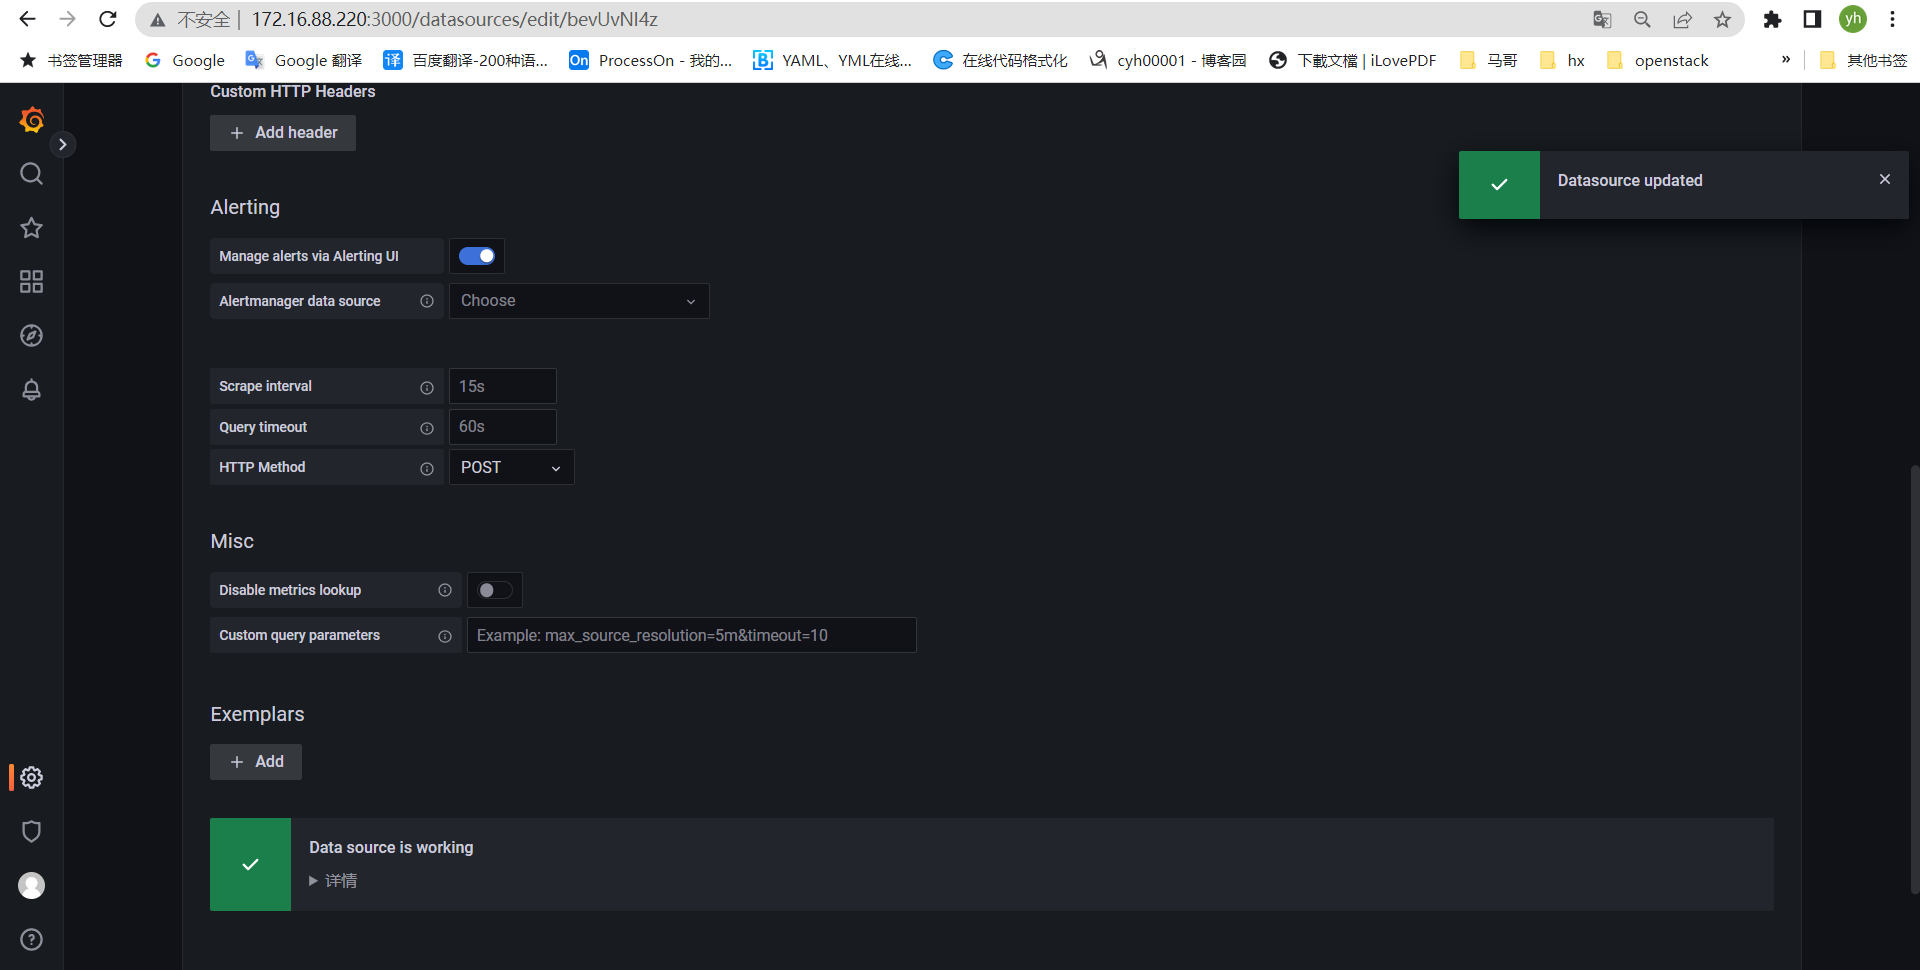
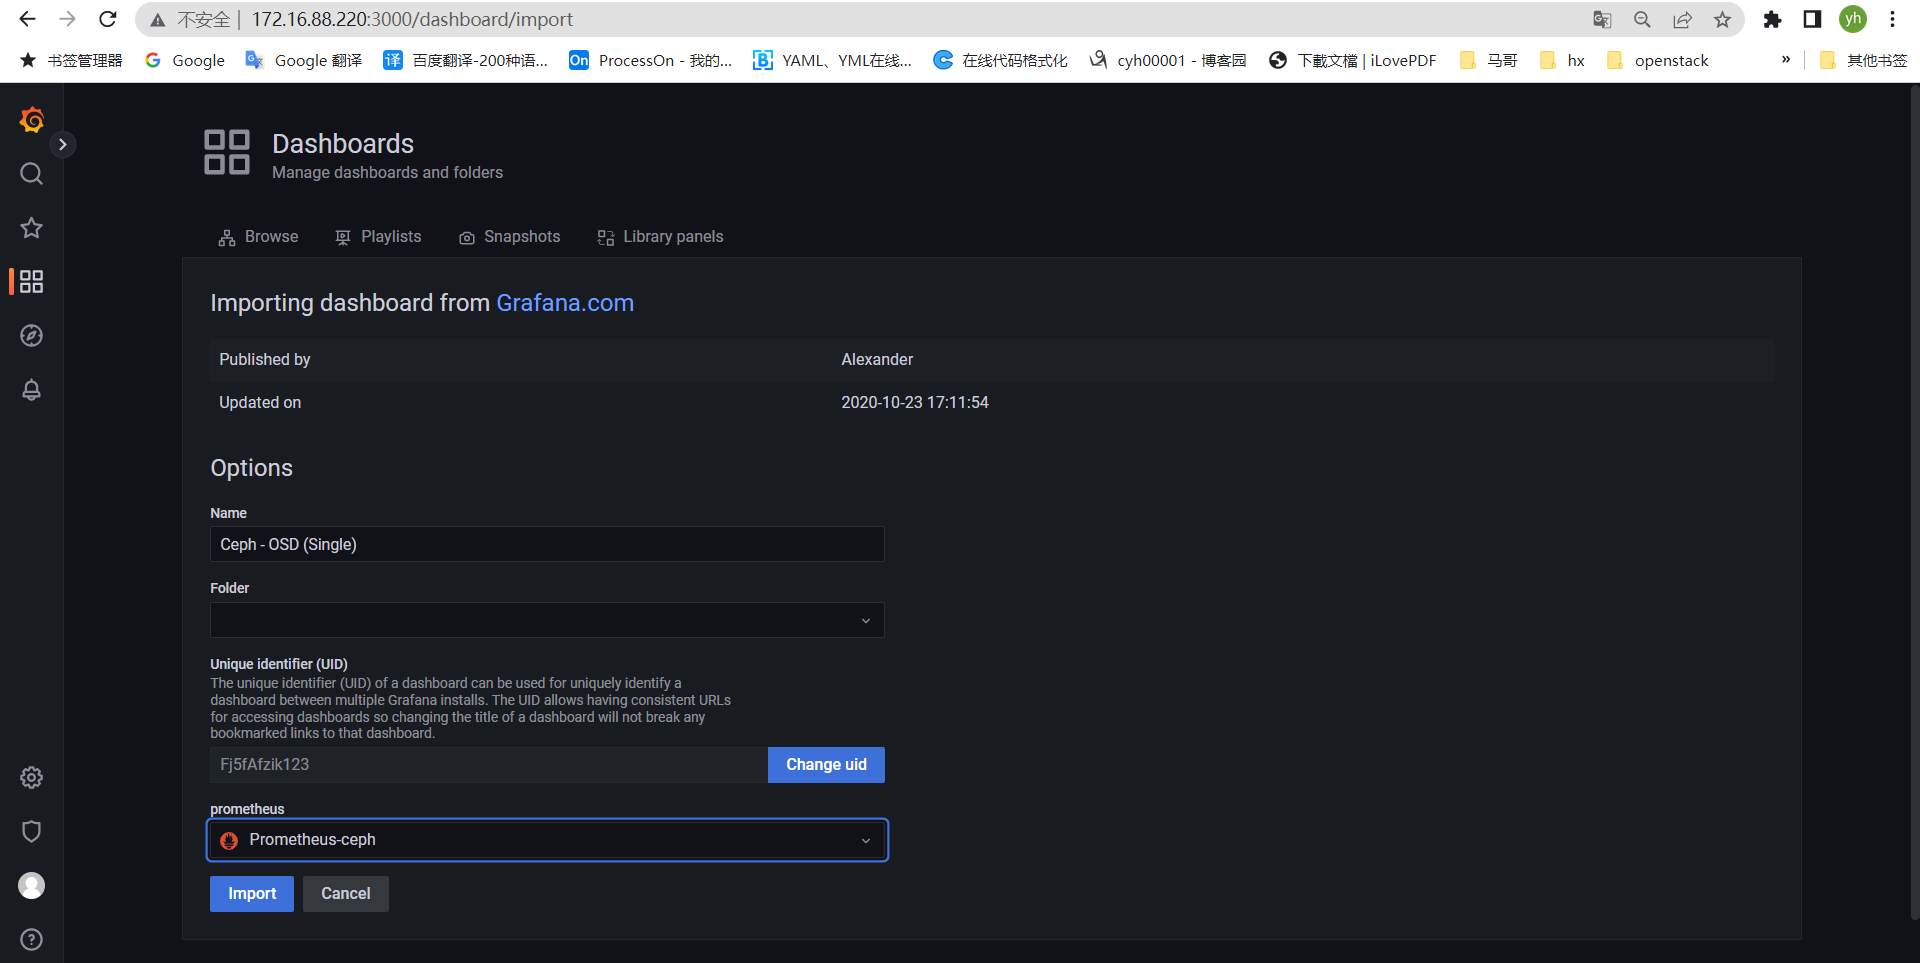
添加Prometheus-ceph数据源
导入模板:
https://grafana.com/grafana/dashboards/5336 #ceph OSD
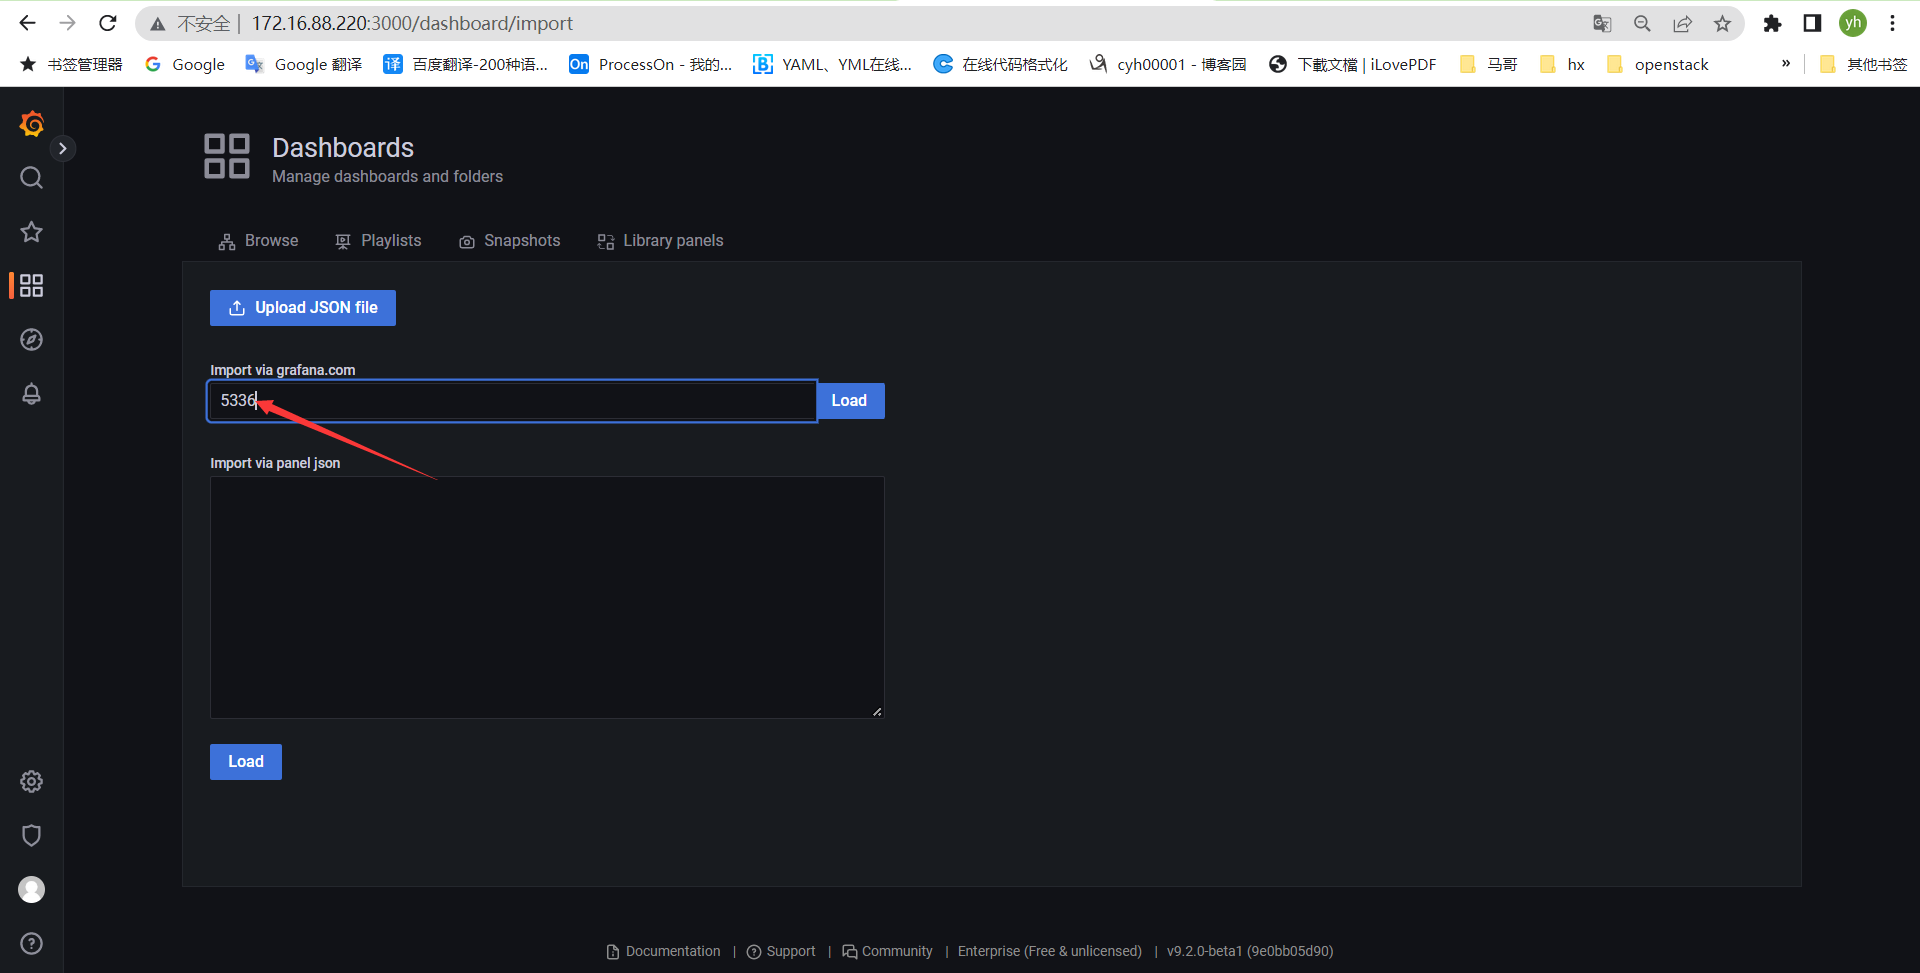
https://grafana.com/grafana/dashboards/5342 #ceph pools
https://grafana.com/grafana/dashboards/7056 #ceph cluser

https://grafana.com/grafana/dashboards/2842
